Get the latest insights shaping the logistics industry with Trinity’s May 2026 Freight Market Update, powered by our Freightwaves Sonar subscription.
A Market in Transition
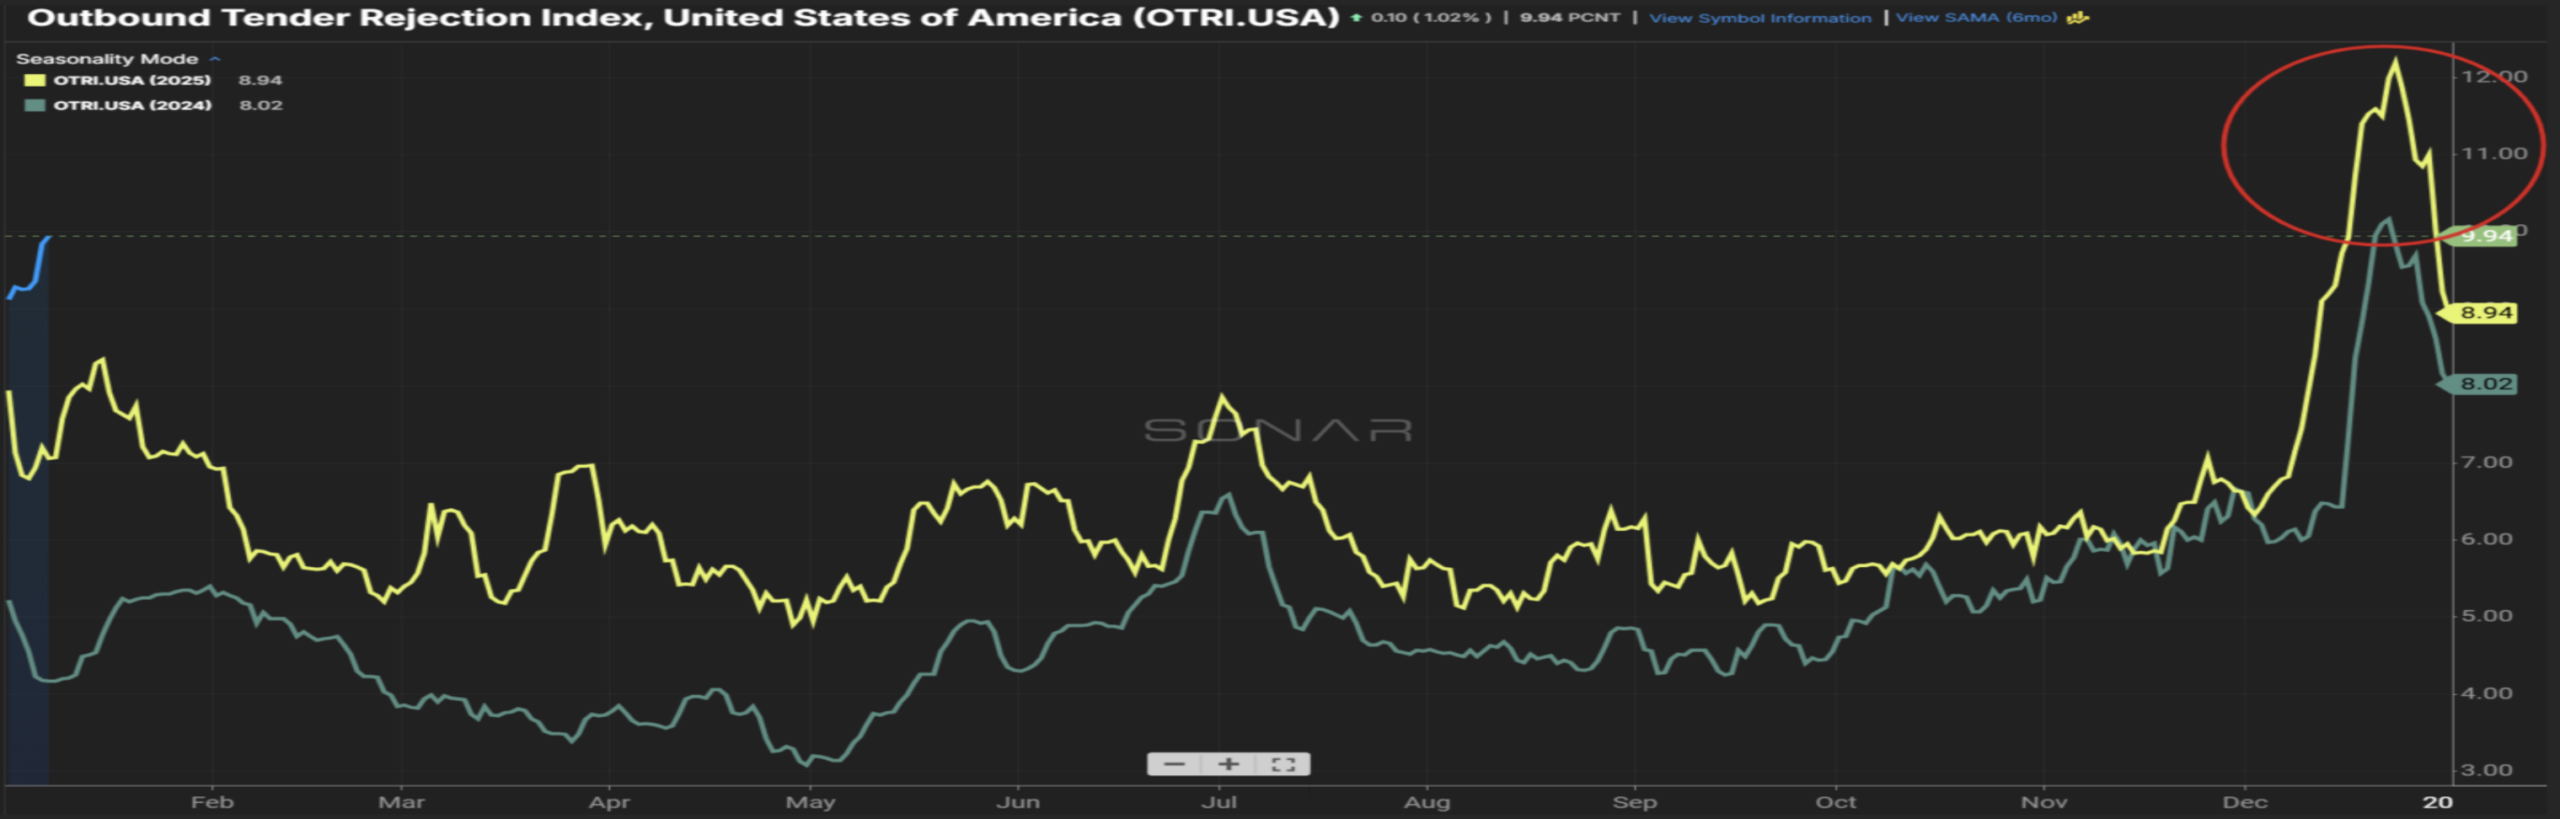
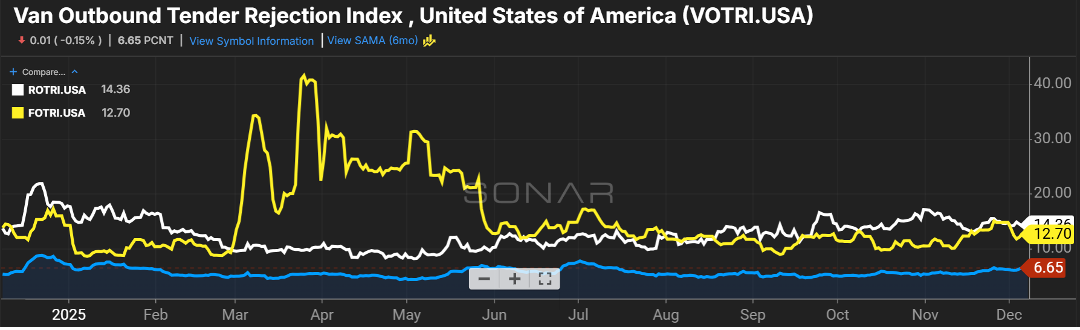
Much of the recent conversations have been around the rate at which carriers are rejecting shipments where a contracted rate is in place with the shipper.
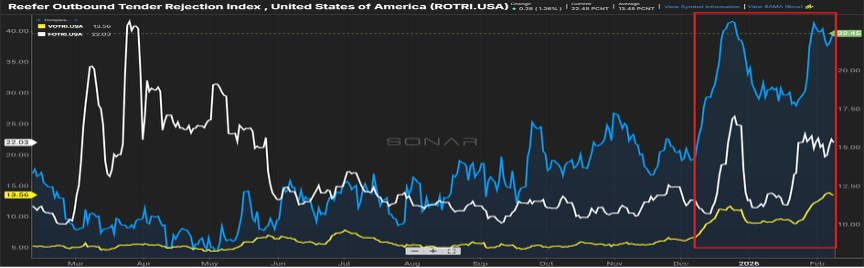
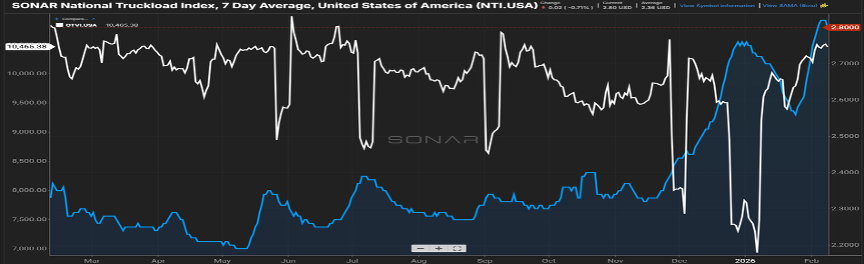
Figure 1.1 shows that elevation over the last 90 days, being led by the flatbed sector with a rejection rate of just over 1 out of every 3 shipments. What has not been getting as much press is the overall volume of freight in the industry as seen in Figure 1.2.
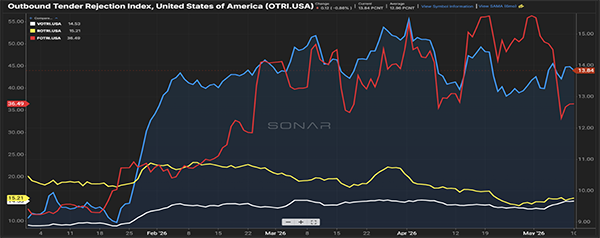
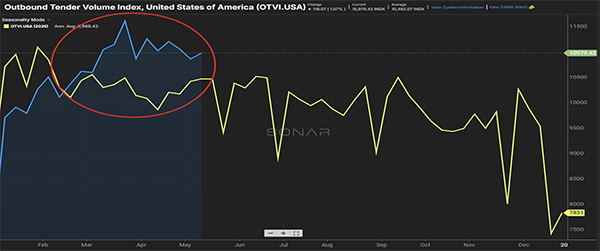
Sure, it’s anticipated that April and May see the effects of produce as we head towards the early summer peak freight months. But we’re seeing volumes that are trending 5-10% higher than last year for the last few months.
Well wait a minute, if the volumes are trending up, then why are the overall tender rejection rates trending slightly down? The simple answer is that shippers have right-sized pricing guides to reflect the market.
For all of ’24 and ’25, there was not much movement in the freight rates. That changed almost overnight at the start of this year, and it has taken a few months for shippers to adjust.
While a slight softening in rejection rates suggests a better rate and volume balance, an average rejection rate of almost 14% shows a slight advantage to carriers when it comes to rate negotiations.
The Compliance Impact Grows
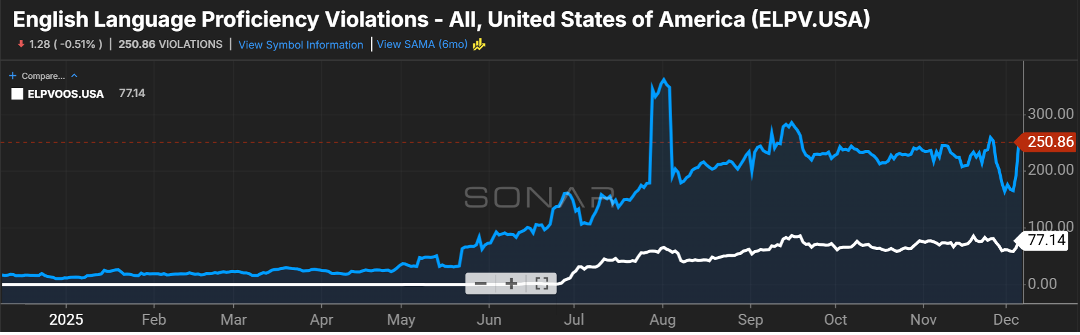
The chatter is not as heavy around the impact of drivers being taken out of the market due to non-compliance with the English language proficiency mandate, but it is still happening and impacting overall capacity.
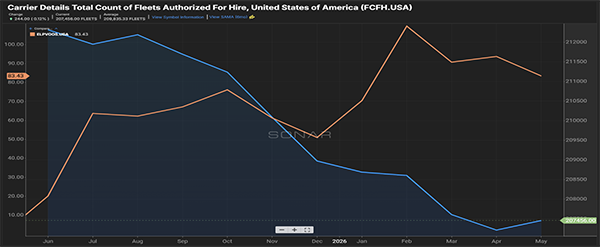
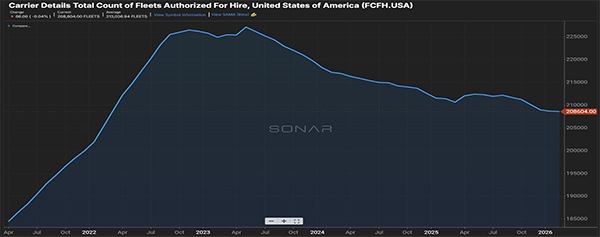
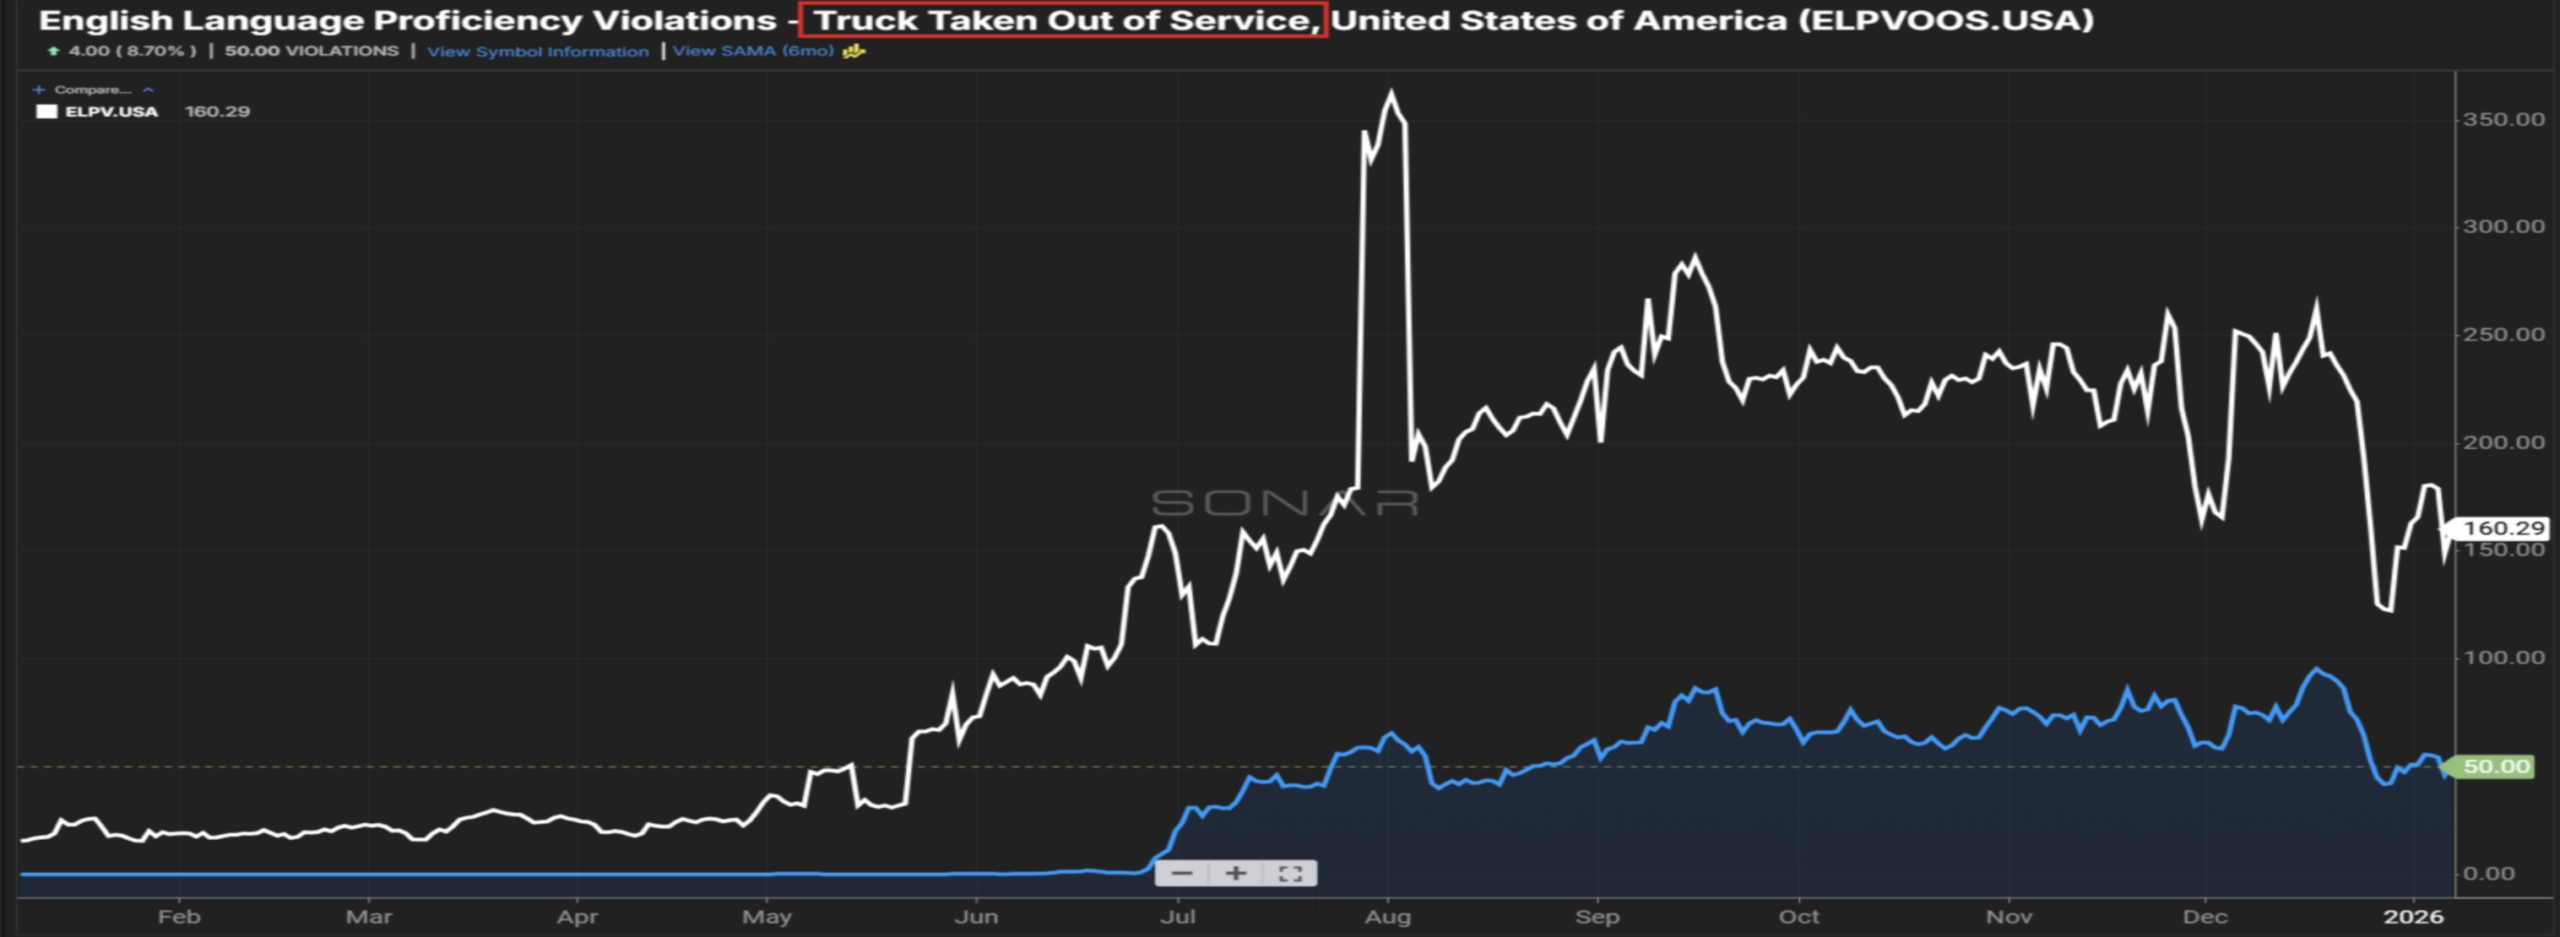
Figure 2.1 shows a decline over the last year with the count of for-hire carriers, with a reduction of about 3% over the past year. Conversely, the number of drivers being sidelined because of failing to understand basic commands and road signs in English has increased over that same time. On average, 83 drivers are being placed out of commission daily.
While nobody likes to see people being placed in a position of not being able to work, from a safety perspective, for those being entrusted with the safe operation of an 80,000-pound vehicle on U.S. roads, being able to understand warnings and potential hazards is paramount.
Imports Picking Back Up
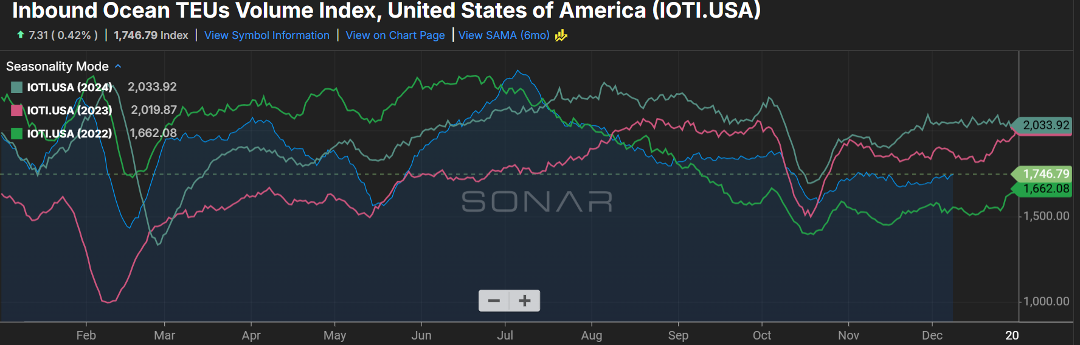
With all the talk about domestic over-the-road volumes, it can be easy to forget what is happening at our U.S. ports.
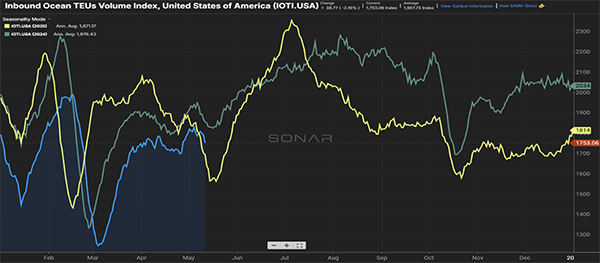
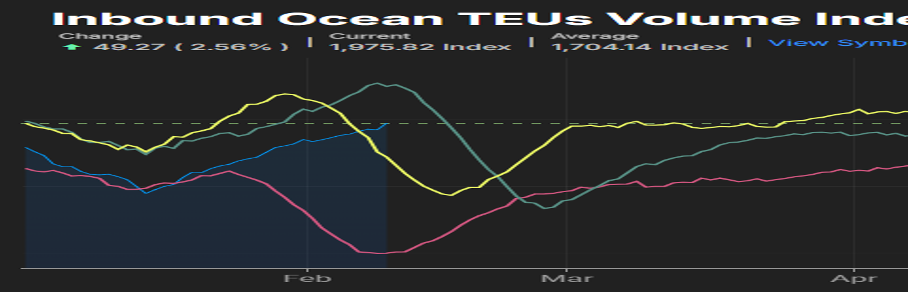
There are several overhanging themes, with the global trade war and the happenings in the Strait of Hormuz. Figure 3.1 shows the impact on inbound container volumes, a slight decline versus prior years year-to-date, but recent volumes have slightly surged ahead of the 2025 pace.
It’s anticipated that volumes will start to increase as we head towards peak season, with more than normal volume of this import freight traveling to its final destination via rail versus over-the-road.
Don’t Let Market Shifts catch you off guard
Freight conditions can shift quickly and have a major impact on your transportation strategy. Subscribe to receive our monthly Freight Market Update in your inbox and also have the option to receive our Weekly News update for a quick Friday morning snapshot of what’s shaping the market.
Don't Miss the Next One – Sign UpLooking for a more reliable transportation strategy? Request a free quote for your next shipment and see how Trinity helps shippers stay flexible in changing market conditions.
Quote Your Next Shipment With TrinityGet the latest insights shaping the logistics industry with Trinity’s April 2026 Freight Market Update, powered by our Freightwaves Sonar subscription.
FUELING THE FIRE
It certainly feels like we must start the market update with the impact fuel is having on rates.
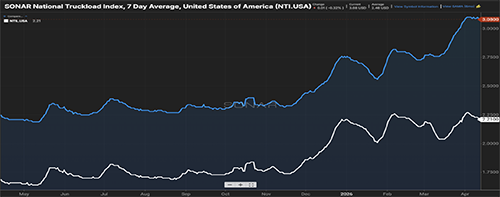
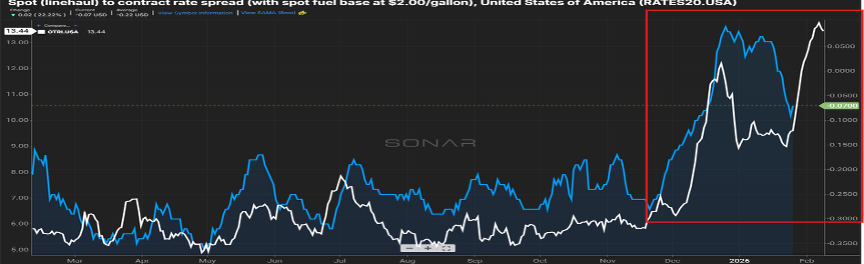
Figure 1.1 looks at the average rate for a truck (blue line) being above $3.00 per mile. The white line is less fuel, currently $2.21 per mile. The $0.87 variance is the impact of fuel being, on average, at $5.86 per mile. Keep in mind that is the average, with the lowest cost per diesel in the Midwest at $5.30 per gallon compared to the other extreme being California at $7.56 per gallon.
For many shippers, having a fuel surcharge table in place accounts for the ebbs and flows of fuel prices. For shippers that rely primarily on spot rates, that increase has accounted for an additional $300-$350 for an average 700-mile shipment.
Unfortunately, with the continuing Iran conflict, shippers need to budget for this cost increase for the foreseeable future. Even if the conflict is resolved today, fuel prices will remain high. While we would see oil prices stabilize almost overnight, the same would not be the case for oil refineries and ultimately the price at the pump. That’s because the refineries would still be processing higher-cost crude that they have already purchased and thus looking to get the return on their investment at $100+ per barrel.
Relief at the pump could happen as soon as a few weeks, but most likely it will take a month for that reduced cost of oil to show up in gas and diesel prices.
THE ENERGY SECTOR SURGE
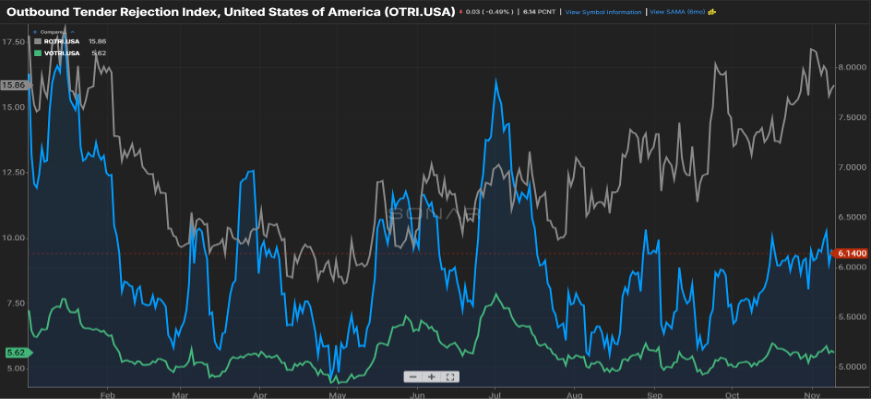
The flatbed sector continues to lead the way with regard to rejection of freight tenders.
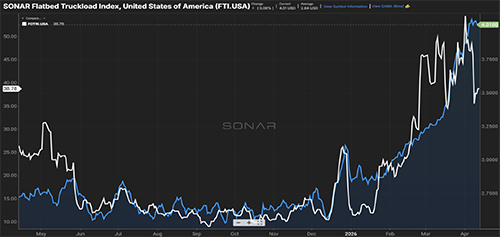
Figure 2.1 shows the rejection index just shy of 40%. While this is encouraging, especially considering rejections are typically not high in the first quarter of the year, the underlying reason for the rejections may not be sustainable.
First, it’s not being driven by the housing market. A depressed housing market was clearly reflected by the low rejection rate seen through much of 2025.
Rather, what seems to be the underlying driver is the energy sector, particularly the new data center builds. Many people think of semiconductor chips when they hear data centers. It takes a lot of copper, steel, and concrete to build these facilities. Flatbeds are the primary resource for delivery of these goods.
DRIVER DOWNSHIFT
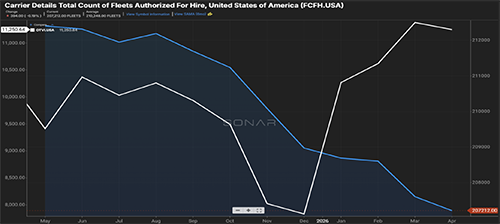
Lastly, the slow exodus of carriers continues as indicated in Figure 3.1.
This worry for shippers has been further fueled by the uptick in volumes as shown by the white line below, and this is an environment where produce is not in full swing.
There are several initiatives around the quality of drivers on the road, and the forward movement of Delilah’s Law in Congress will make a tight-capacity situation even tighter. At its most extreme impact, we could realize a world where 15% of the current driver population is taken off the road. This won’t be an overnight impact, but as this would be a law versus a mandate, 12 months to see this impact is very realistic.
Shippers will need to revisit their freight playbook to ensure goods are leaving their docks in a timely and safe manner.
Stay Ahead of the Market
Enjoyed the April 2026 freight market update? Subscribe to our email list to receive next month’s delivered straight to your inbox in our monthly newsletter. Looking for more frequent insights? Choose our Weekly News Update for logistics news in your inbox every Friday morning.
Don't Miss the Next One – Sign Up Quote Your Next Shipment With TrinityThe Strait of Hormuz closure and the supply chain disruption we’re currently seeing from it – sure feels like we’ve seen something like this before, and it did not resolve quickly.
Remember the Suez Canal? Back in 2021, it became blocked for several days but took months for supply chains to fully recover. The COVID pandemic followed a similar pattern – a sudden shock to global supply chains, exposing just how fragile and interconnected they really are.
That’s the reality of today’s supply chains. Things can break quickly but then often take much longer to stabilize. Even short-lived disruptions can create long recovery cycles in freight.
The current Iran War is shaping up to be another example in supply chain disruption history, except with a different kind of impact. This isn’t just about delayed shipments or port congestion. It’s a multi-layer event that’s affecting fuel markets, manufacturing inputs, and freight demand simultaneously.
In this article, we’ll break down what’s happening in the Strait of Hormuz, why it matters, how it’s impacting supply chains now, and what logistics leaders should be doing to stay ahead and stay resilient.
Iran War and Its Connection to the Strait of Hormuz
The current disruption traces back to the escalation of the Iran War on February 28, 2026, when U.S. and Israeli forces initiated strikes on Iran, prompting retaliation across the region and sharply restricted access to the Strait of Hormuz. This took place after years of rising tension with Iran and previous attempts to negotiate were unsuccessful.
Even ahead of the war initiation, Iran’s Islamic Revolutionary Corps (IRGC) had seized several foreign oil tankers and threatened violence in the Strait of Hormuz.
As of today, there is sustained disruption. Iranian attacks have targeted oil infrastructure in the region, including vessels in the Strait. There have also been several underwater mines employed in the Strait, noted by American intelligence assessments.
And while there are currently no physical blockades preventing ships from traveling through the Strait of Hormuz, there have been threats along with drone and missile attacks that are preventing tankers from going through.
Since the outbreak of the war, there has been a drop of 95% of vessel traffic through the Strait of Hormuz, falling from a daily average of 130 ships per day down to fewer than 100 over the last several weeks.
While Iran has since indicated that “non-hostile” vessels may transit with coordination, uncertainty remains high, which alone is enough to shape behavior in global shipping.
Why the Strait of Hormuz is So Important to Supply Chains
The Strait of Hormuz isn’t just another shipping lanes. It’s one of the most critical chokepoints in global supply chains because:
- Roughly 20% of global petroleum consumption moves through it
- Around 20% of LNG exports pass through it
- Nearly 1/3 of global fertilizer trade relies on this route
Any disruption to the Strait impacts the global pricing of fuel almost immediately. And it’s not just Iranian oil at stake here. The Strait of Hormuz is a key export route for major energy producers in Saudi Arabia, Iraq, Kuwait, Qatar, and UAE.
There are very few alternative lane options that exist to export oil if the Strait is impacted as it’s one of the only routes capable of handling the world’s largest crude carriers at scale.
That’s what makes this different from events like the Suez Canal blockage. Suez primarily impacted containerized goods, affecting certain markets. But Hormuz impacts energy and energy affects everything.
How It’s Affecting Supply Chains
Fuel
The most immediate and visible impact of the Iran War is fuel. Consumers saw it first at the pump. Carriers are now seeing it through rising operating costs. Shippers see it in the form of fuel surcharges and rate adjustments.
“Fuel prices are often one of the earliest and most impactful variables, including both ocean and drayage shipping rates,” said Chad Schilleman, Vice President of Drayage Services at Trinity.
While fuel is the first domino to fall, it’s not the last. Higher fuel costs ripple outward into consumer spending and reduced demand. Over time, that demand pressure will feed right back into the freight markets.
Ocean Freight
So far, the impact on ocean freight has been more measured than expected. Most carriers have already rerouted shipments to avoid the Strait of Hormuz. As a result, import flows have remained relatively stable, although transit times are increasing and costs are rising. Overall, networks are still functioning.
At this stage, this is not a port shutdown or capacity collapse scenario – think more rerouting and added cost pressure.
Domestic Freight
The more significant shift from the Iran War may hit domestically, especially if it continues.
“If the war with Iran is prolonged, it will create a freight need because of the increased demand for defense production. Most of what will be needed can be sourced domestically, if not from a nearshore perspective,” said Greg Massey, Senior Vice President of Agent Development at Trinity.
Recently, the U.S. Pentagon has requested additional funding for defense spending related to the Iran War. If that goes through, there will indeed be a ramp up in the manufacturing and movement of related raw materials, components, and finished goods. This could create a potential upside in pressure on domestic freight demand, particularly in flatbed, specialized freight, and industrial supply chains.
Industry-Level Pressure: Sectors Seeing the Most Disruption
The effects of the Iran War and the disruption in the Strait of Hormuz are not confined to transportation. They are pushing directly into the core of global production. Industries that rely heavily on energy and petrochemical inputs are feeling the pressure first, and in many cases, most acutely.
Automotive
Production depends on a wide range of energy-intensive materials, from coatings and plastics to battery components and semiconductors. At the same time, the Gulf region plays a dual role as both a key shipping route and a major end market for vehicles, especially premium autos.
Fertilizer & Agrochemicals
Agriculture is also under strain, driven largely by the surge in fertilizer prices. Fertilizer prices have surged from $400 to $700 per metric ton since the Iran War began, placing pressure on farmers already operating on tight margins.
Fertilizer production is closely tied to natural gas and petrochemical inputs, so any disruption in energy flows quickly translates into higher agricultural costs. It will impact agriculture cycles, crop production, and overall food pricing, with a downstream effect on food supply chains. There are strong possibilities supply chains may see shortages and increased costs, with early warnings of food security already emerging in the market.
Packaging & Materials
Compared to other materials, plastics (petrochemical based) and aluminum (energy-intensive) are both seeing cost increases. As raw material prices rise, manufacturers are forced to make difficult decisions to either absorb the cost, pass it on, or reduce production.
What ties these industries together is that they are foundational. They all sit upstream of countless other supply chains, meaning disruption here doesn’t stay contained. It cascades outward, impacting everything from consumer goods to industrial manufacturing.
Why This Supply Chain Disruption Will Outlast the Conflict
Even if tension in the Strait of Hormuz eases, the supply chain disruption won’t resolve overnight. That’s because the real challenge isn’t just the event itself, but the imbalance it creates in freight markets.
When shipping patterns need to shift, equipment doesn’t end up where it’s needed. Containers accumulate in some regions while becoming scarce in others. Ports experience congestion unevenly, with some recovering quickly while others remain backed up.
At the same time, contract pricing struggles to keep pace with rapidly changing market conditions, leaving a lag between real costs and agreed upon rates.
Carriers adjust their networks through blank sailings and service changes, but those adjustments take time to stabilize. Meanwhile, inventory flows become misaligned, with goods arriving too early, too late, or in the wrong place entirely.
This is why recovering in freight markets often takes months, not weeks. Stability only returns once balance is restored, and that process is inherently gradual.
Where Disruption Compounds: First-Mile and Drayage
While much of the attention is often placed on ocean transit and long-haul transportation, disruption tends to compound most quickly at the beginning of the supply chain.
Ports become immediate pressure points, especially when volumes shift unevenly or vessels arrive outside of expected schedules. From there, even small delays in drayage can trigger a chain reaction.
A missed pickup or delayed container can impact warehouse operations, delay inventory availability, and ultimately disrupt production schedules.
This is where minor issues escalate into broader operational challenges. Without strong visibility and flexibility at the first mile, it becomes significantly harder to recover downstream.
Freight Market Outlook: Mixed Signals Ahead
The current freight environment is defined by a mix of stability and volatility, depending on where you look.
Short-Term
Import flows have remained relatively stable, largely because ocean carriers have already adapted by rerouting shipments. However, that stability is being offset by rising costs, driven primarily by fuel.
Mid-Term
Looking further out, the picture is more complex. If the Iran War continues, increased defense spending and industrial production could drive new freight demand, particularly in domestic markets. At the same time, regional imbalances are likely to emerge as supply chains adjust unevenly.
Long-Term
Over the long term, one outcome appears increasingly likely: a higher baseline cost structure across transportation modes. Contracts will be repriced, and what was once considered a temporary spike may become part of the new normal.
Beyond Freight: Inflation and Stagflation Risk
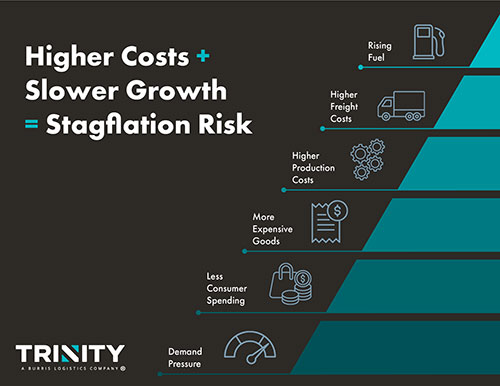
The impact of the disruption extends beyond logistics into the broader economy. Those higher costs feed directly into production, increasing the price of goods. At the same time, consumers facing higher everyday expenses tend to pull back on spending, putting pressure on demand.
This combination of rising costs paired with slowing growth is what creates the risk of stagflation. It’s a challenging environment not just for supply chains, but for the economy as a whole.
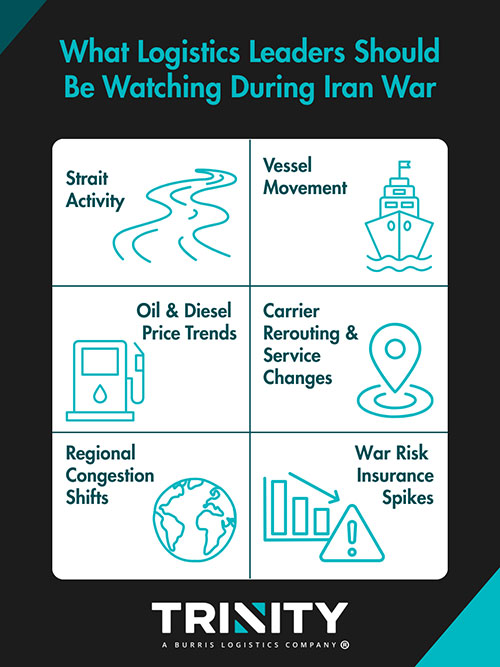
What Logistics Leaders Should Be Watching
In a situation like this, staying informed is critical. However, not all signals carry equal weight, so here are the ones you should be watching.
Strait Activity
Activity in the Strait of Hormuz, including vessel movement and transit patterns, offers a real-time view of risk levels.
Oil & Diesel Price Trends
Oil and diesel price trends provide early insight into cost pressures that will ripple across supply chains.
Carrier Behavior
Rerouting decisions, service adjustments, and capacity shifts can indicate how the market is responding to ongoing disruption.
Regional Congestion Shifts & War Risk Insurance Costs
These patterns and changes can help paint a clearer picture of whether conditions are stabilizing or escalating.
Altogether, these indicators can provide the context needed to make informed decisions during this uncertain environment.
How Shippers Can Strengthen Their Strategy
In today’s market, resilience comes down to preparation and adaptability.
Build Flexibility into Routing & Mode Selection
Shippers that rely too heavily on a single lane, port, or mode are more exposed when disruption occurs. Building flexibility into these strategies will allow for faster adjustments when conditions change.
Reassess Fuel in Budgets & Contracts
With the current impact, fuel can no longer be treated as a stable cost input. Budgeting and contract strategies need to account for ongoing volatility.
Increase First-Mile Visibility & Drayage
Visibility is important here because the small disruptions here can quickly escalate to long-term breakdowns. Understanding where freight is, and where it might get delayed, gives teams the ability to act before issues compound.
Evaluate Inventory Strategy
For critical materials, consider maintaining a buffer of stock to help absorb short-term shocks and prevent production interruptions.
Strengthen Logistics Relationships
Strong relationships across the supply chain matter more than ever in uncertain conditions. Communication and collaboration often outweigh price as the most valuable assets during this time.
Disruption is Today’s Baseline. Resilience is Your Competitive Edge.
If there’s one consistent pattern in global supply chains today, it’s that disruption is no longer the exception – it’s the baseline. And these disruptions rarely resolve as quickly as the headlines fade.
The situation in the Strait of Hormuz makes that clear. Even without a full closure, the ripple effects are already moving through fuel markets, industrial production, and freight networks. Those effects will continue to unfold in the weeks and months ahead.
While in this kind of environment, just having access to capacity isn’t enough.
The companies that stay ahead during this event are doing more than waiting around for things to stabilize. They’re the ones actively monitoring the signals, adjusting their strategies, and making informed decisions before disruption fully materializes in their network.
Often, these companies have access to what’s most critical during disruption – the right partner.
At Trinity Logistics, we don’t just arrange the movement of your freight. We help customers understand what’s happening in the market, what it means for their business, and what to do next.
With real-time market visibility and more than 45 years of experience navigating disruption, we help you stay proactive instead of reactive.
Because supply chain resilience isn’t about avoiding disruption. It’s about being prepared for it, adapting to it, and continuing to move forward while your competition is still trying to catch up.
GET A QUOTE & GET AHEAD OF WHAT'S COMING NEXTTrinity Logistics is proud to celebrate its parent company, Burris Logistics, for earning the prestigious 2026 USA TODAY Top Workplaces Award – a recognition that reflects the strength of the culture shared across all Burris companies.
The USA TODAY Top Workplaces recognition honors organizations with 150 or more team members that are committed to building strong, people-first cultures. Out of more than 42,000 invited organizations, winners were selected based on authentic team member feedback captured through a confidential survey conducted by Energage, the HR research and technology company behind the Top Workplaces program since 2006. The results are calculated based on employee responses to statements about Workplace Experience Themes, which are proven indicators of high performance.
For Trinity Logistics, this recognition reinforces the culture our Team experiences every day – one built on trust, collaboration, and a shared purposed of improving lives and supply chains by solving tough problems. As part of the Burris family of companies, alongside Honor Foods and Eagle Business Credit, Trinity contributes to a larger mission that prioritizes both people and performance.
“This award is an honor that truly reflects the voices of the Team Members at Trinity Logistics and those across Burris,” said Sarah Ruffcorn, President of Trinity. “It speaks to the special culture we have built together- grounded in trust, collaboration, and a shared commitment to improve lives and supply chains. All of us at Trinity are incredibly proud to be a part of it!”
Founded in 1925, Burris Logistics recently celebrated its 100th year as a proud, fifth-generation-run, family-owned business. Today, its companies collectively support businesses nationwide through foodservice redistribution, freight management, logistics technology, and factoring.
Team Members across Trinity and the broader Burris organization consistently point to supportive leadership, opportunities for growth, and strong values as what make this culture stand out. The environment is described as collaborative, empowering, and positive – all qualities that directly impact how Trinity and all of Burris serve its customers, carriers, and partners.
“This recognition means a lot to us because it comes directly from our Team. Our purpose statement, ‘Improving lives and supply chains by solving tough problems’ is really the driving force of all that we do. We believe that when we take care of our people, we’re also taking care of our customers, partners, and each other,” said Donnie Burris, CEO of Burris Logistics. “I’m proud of the culture our teams have built across our companies. It’s about showing up every day, supporting each other, and continuing to grow together.”
“Being named a USA TODAY Top Workplace is an honor because it speaks directly to the culture our Team Members help create every day. At Honor Foods, we are committed to building an environment where people feel valued, heard, and connected to a shared purpose. This recognition belongs to our team and the culture they make stronger through their dedication and heart,” said JD Spangler, President of Honor Foods.
In addition to this award, Burris Logistics has seen record scores on safety, placing its companies in the upper quartile for its industry, along with some of the lowest turnover rates in company history.
Trinity is proud to be part of the Burris family and this shared success.
Learn More About Trinity Logistics Learn About Burris & Our Sister CompaniesABOUT BURRIS LOGISTICS COMPANIES
At Burris Logistics, you’re more than an employee — you’re part of a purpose-driven team. As a proud fifth-generation, family-owned company founded in 1925, we blend innovation and tradition to deliver industry-leading service through our companies: Honor Foods, Trinity Logistics, and Eagle Business Credit. Headquartered in Milford, Delaware, with locations nationwide, our team embraces a culture of service. Our commitment to improving lives and supply chains isn’t just a purpose statement—it’s how we operate every day. We foster a workplace where teamwork fuels opportunity: competitive benefits like parental leave, tuition reimbursement, and fertility and adoption assistance reflect our dedication to growth and well-being. The result? A workplace where innovation thrives, collaboration is natural, and every Team Member has what they need to succeed and deliver Personal.Service.Excellence. in every interaction.
ABOUT ENERGAGE
Making the world a better place to work together.TM
Energage is a purpose-driven company that helps organizations turn employee feedback into useful business intelligence and credible employer recognition through Top Workplaces. Built on 20 years of culture research and the results from 30 million employees surveyed across more than 80,000 organizations, Energage delivers the most accurate competitive benchmark available. With access to a unique combination of patented analytic tools and expert guidance, Energage customers lead the competition with an engaged workforce and an opportunity to gain recognition for their people-first approach to culture. For more information or to nominate your organization, visit energage.com or topworkplaces.com.
Get the latest insights shaping the logistics industry with Trinity’s March 2026 Freight Market Update, powered by our Freightwaves Sonar subscription.
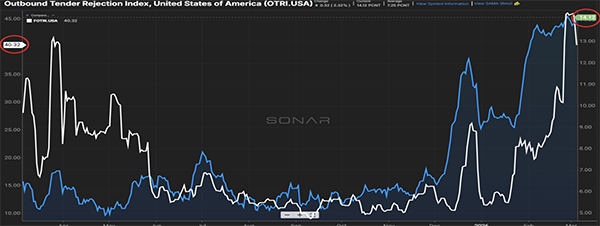
The Rejection Revival
There are definitely things afoot that can flip the market as we currently know it.
For now, let’s talk about the word “no.”
Carriers were not used to saying that word for much of the last 3 years.
Recently, that has not been the case. Rejection of tenders to carriers started to creep upwards in December 2025.
Maybe it was a seasonal thing. But then it continued into January.
Maybe it was related to the weather. Yet here we are on the cusp of spring, and rejections still remain elevated at 14% (Figure 1.1).
What is even more impressive is that the rejection rates we are seeing on open-deck shipments are currently hovering around 40%.
Wait, did you say flatbeds, at a time when typically, you don’t see much activity for that type of equipment, are seeing a 40% rejection rate?! Yes, we did.
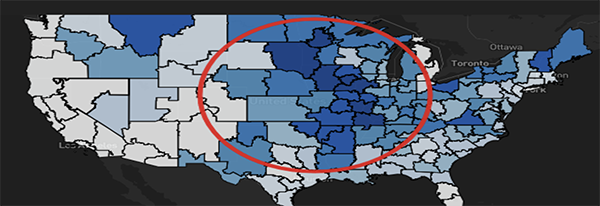
The Midwest Surge
One needs to look no further than the Midwest to get an idea of where the capacity crunch is manifesting itself.
It’s common to see dark shades of blue (Figure 2.1), measuring the severity of rejection rates, on the East and West Coast states. Seeing it this pronounced in the Midwest, in the winter months, is an abnormality.
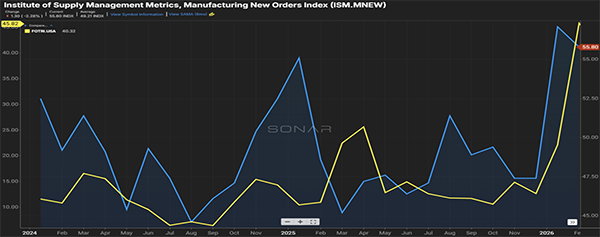
Part of it can be attributed to a demand for refrigerated trailers to keep product from freezing during transit. Another part can be attributed to an increase in the manufacturing side (Figure 2.2).
The manufacturing index has recently broken the 50-score barrier, which typically signals growth, and the fact that the rejection index for flatbeds is mirroring that, is no coincidence. Much has been made of the recent development happening around new data centers. There’s a good bet much of that increased activity is directly related to the construction of them.
The Capacity Reset Continues…
Finally, the exit of carriers in the freight market continues (Figure 3.1).
Carriers that were already under pressure from increased costs and stagnant rates (although recent spot rates have provided some relief), along with mandates and regulation enforcement, not to mention the ability to simply enter the trucking market being more stringent, has allowed the capacity side to find an equilibrium after the surge experienced years earlier that cannibalized rates.
Stay Ahead of the Market
Enjoyed the February 2026 freight market update? Subscribe to our email list to receive next month’s delivered straight to your inbox in our monthly newsletter. Looking for more frequent insights? Choose our Weekly News Update for logistics news in your inbox every Friday morning.
Don't Miss the Next One – Sign Up Quote Your Next Shipment With TrinityGet the latest insights shaping the logistics industry with Trinity’s February 2026 Freight Market Update, powered by our Freightwaves Sonar subscription.
last year’s playbook doesn’t work anymore
What a difference a year makes! This time last year, carriers were saying “yes” on almost every load tender that came their way. Fast forward 12 months, and tender rejection rates are 2-3x what they were at the start of 2025.
Figure 1.1 shows the breakdown by van (yellow), reefer (blue) and flatbed (white).
The recent weather certainly has been a secondary catalyst to an already escalating rejection trend seen from carriers towards the end of last year. As a result, it has (Figure 1.2) pushed spot rates 20% higher year-over-year, even as volume has remained stagnant.
carriers are keeping their options open
With spot rates on the rise, the delta compared to contract rates has become almost nil (Figure 2.1).
Contract carriers may be constrained by lack of capacity versus several months ago in certain areas, however it’s also plausible that carriers (and typically those that don’t have a minimum acceptance threshold on contracted freight) are very capable of providing the needed capacity, but simply hedging their bets on a better paying, similar lane on the spot market.
Shippers are no doubt having to reach further down their list of carriers and even forcing more freight to the spot market.
carriers are keeping their options open
While Figure 3.1 below, which shows the inbound container volume to the U.S., could give reason for optimism when you compare the current year (blue) to past years, it’s a bit of fool’s gold for continuing the ascent.
This year, the Chinese New Year (also known as the Lunar New Year) will occur between February 17th and March 3rd. Prior years have seen the New Year begin in late January or early February. U.S. inventories have declined over the past year, and tariff or no tariff, shippers will have no choice to restock in the face of consumer demand.
It’s anticipated that imports will follow a traditional seasonal pattern sans the later than normal decline that always happens around the Chinese New Year.
Stay Ahead of the Market
Enjoyed the February 2026 freight market update? Subscribe to our email list to receive next month’s delivered straight to your inbox in our monthly newsletter. Looking for more frequent insights? Choose our Weekly News Update for logistics news in your inbox every Friday morning.
Don't Miss the Next One – Sign UpStay up to date on the latest information on conditions impacting the freight market, curated by Trinity Logistics through our Freightwaves Sonar subscription.
Let The 2026 Freight Games Begin
Well, there certainly has been a shift in the freight market just in the last 30 days. One of the best canaries in the cave for market health is the rejection index – the rate at which contracted carriers are saying “no thanks” to tendered freight tendered.
For a good two years, five percent was the norm, meaning shippers didn’t have to go too far down the routing guide to find a willing participant. Slowly, over the course of the last six months, that rate has been edging up.
Then in December, the ascent got more rapid, with the rejection rate touching, and eclipsing, the 10 percent mark (Figure 1.1). While the rejection rate at the end of last year was about 20 percent higher than 2024, the same could not be said about the volume side of the equation, with December 2024 being a better volume month than this past December.
So that can really point to one thing – less capacity. Sure, some of that is the time of year, as drivers tend to extend the holidays. But one can not discount the impact – either real or perceived – of less drivers due to regulation enforcement (Figure 1.2).
January and February are typically lighter volume months, so the impact may not be as pronounced. However, when we hit March, and certainly April, if capacity continues the downward trend as we anticipate, expect rates to increase on the carrier side and compliance with routing guides to suffer.
The Tariff Coin Flip
Recently, Craig Fuller, CEO at Freightwaves and Sonar, gave really good insight into the current inventory situation of retailers and the pending impact of a ruling on the IEEPA tariffs.
As you may recall, these were the tariffs put in place as an emergency measure last year. As you would expect, many importers are and have been anxiously waiting on a ruling by the Supreme Court – one way or the other – to provide clarity for their business operations.
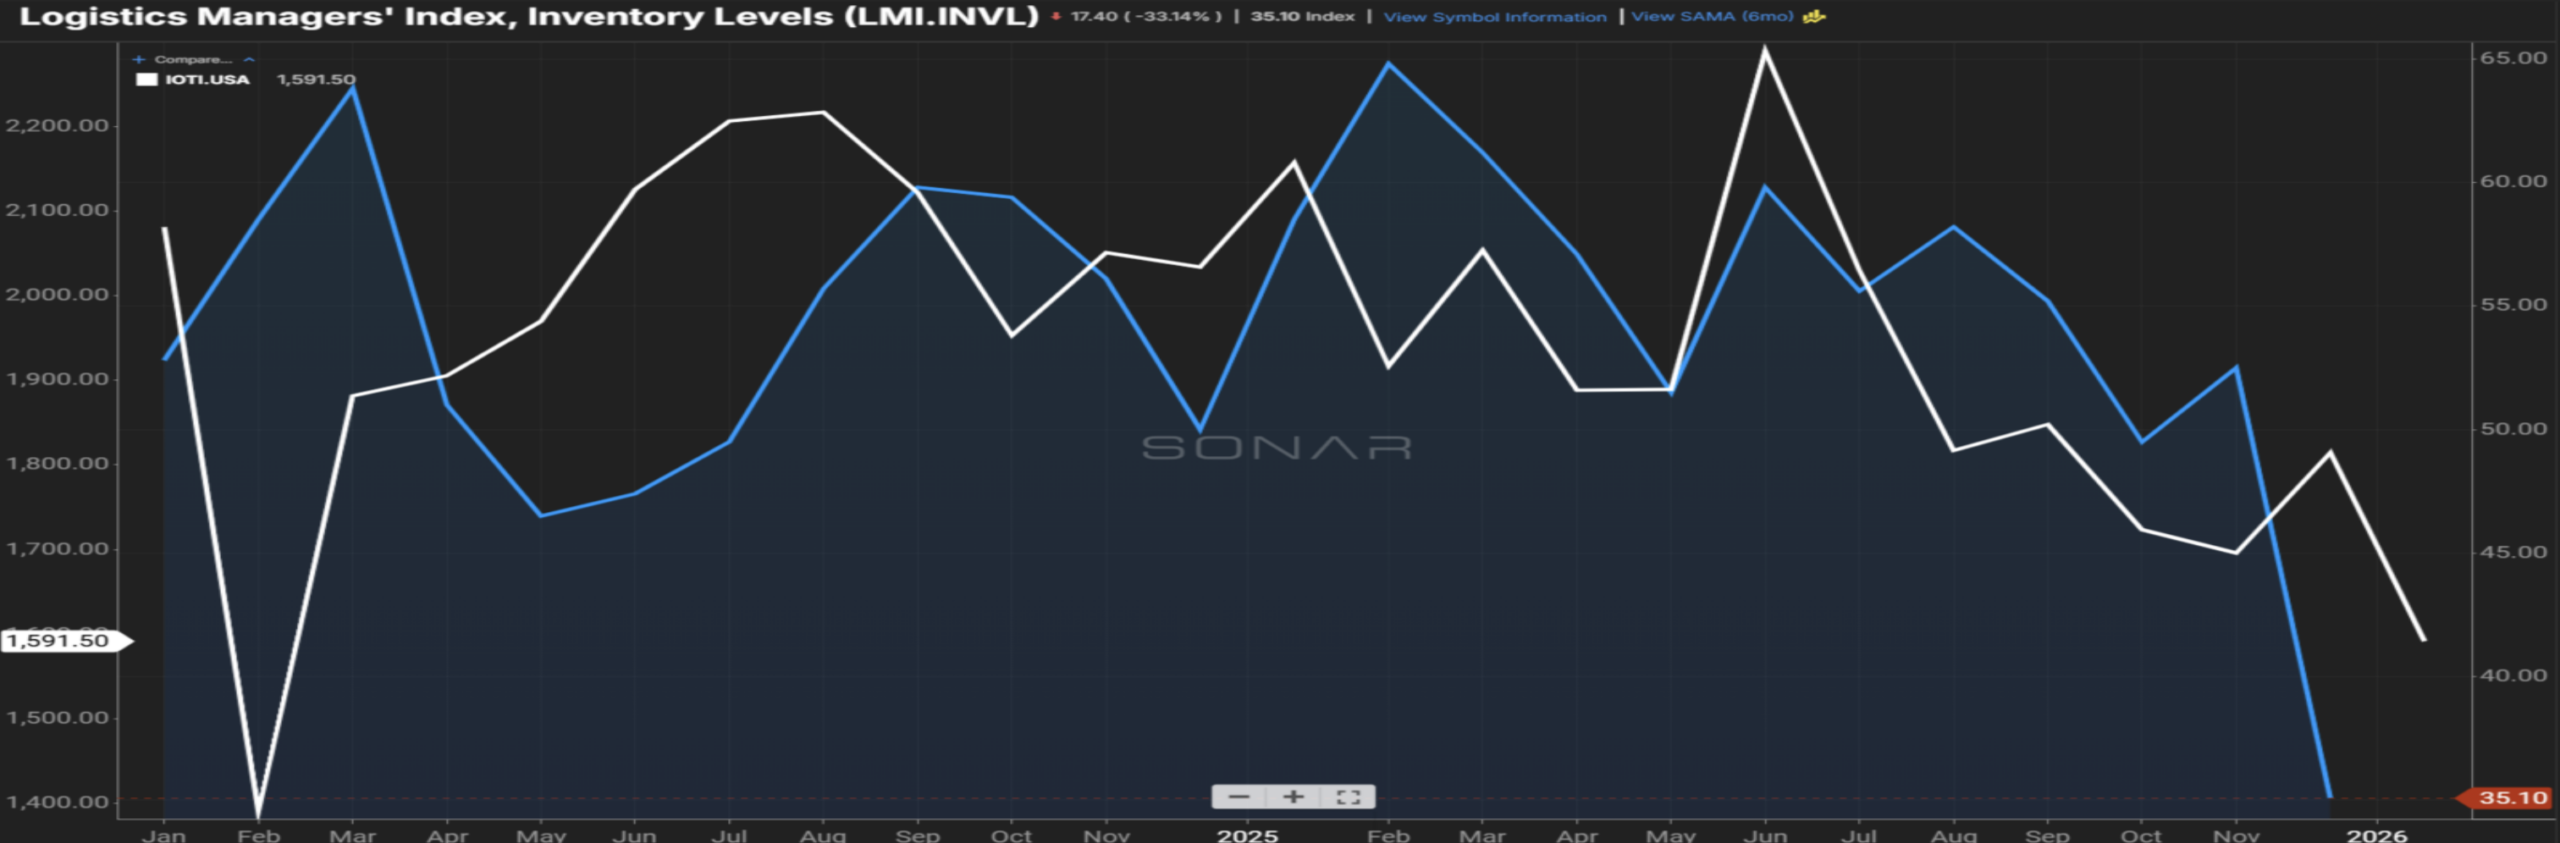
As you can see from Figure 2.1, inventory levels have steadily declined over the past few years as excesses have bled off, and that has been followed in lock step with inbound ocean volumes. Depending on the ruling, most likely one of two things will happen.
If the tariffs are rescinded, shippers will look to capitalize on a window to bring in freight and not be subject to the higher tariffs. Now, there are ways for the administration to re-enact these tariffs, but that process could take three to six months.
If the opposite holds true, and the tariffs are affirmed, at least it gives clarity to shippers, and they will look to restock depleted inventories. Reading my crystal ball, if the tariffs are rescinded, and we have a surge in import volume – at the same time we have the capacity side decreasing – we could be in for a perfect storm with regards to freight rates.
With all the craziness that has happened recently, and is potentially on the horizon, even though freight volumes may not feel like it, now is the time for shippers to cozy up to their carrier and broker partners to ensure their products get in front of the consumers before the competition. Let the games begin!
Stay Up To dAte
Looking for a more frequent update? Subscribe to our newsletter and receive the top five logistics articles of the week every Friday morning by selecting “Weekly News Update” when you select your preferences.
Get Weekly News Updates in Your InboxStay up to date on the latest information on conditions impacting the freight market, curated by Trinity Logistics through our Freightwaves Sonar subscription.
Stockings Full of Slow Shifts in the Freight Market
Despite ongoing demand softness, the next six to 12 months point to a market driven not by shippers, but by significant changes on the carrier side.
There has been much in the news around driver competency, whether it’s the English Language Proficiency (ELP), non-domiciled CDL’s, or the shutdown of sub-par driver training facilities. This has caused pockets of capacity shortages in the market, be it on a lane or market perspective.
Many have asked how much these initiatives impact capacity. It’s certainly a slow drip, but Figure 1.1 shows that indeed drivers are being placed out of service for violations in proficiency with the English language as it pertains to reading and understanding road signs.
Why the blue line (total ELP violations) does not track 100 percent with the white line (driver being taken out of service because of a violation), unfortunately I don’t have the answer.
There’s also been a crackdown on the legitimacy of providers for electronic logging devices (ELD). The shift from allowing providers to self-certify to a process that verifies the ELD works as intended, will not necessarily take drivers off the road, but it will right-size the miles driven.
By some, it is anticipated that drivers using a device that allows for manipulation of driving and down-time, will see their time behind the wheel cut in half. While most likely not as impactful as regulations targeted at the driver’s ability, it will contribute to the declining capacity.
Reefer Rejections Take Top Spot
The decline in capacity will show up in the tender rejection index, the rate at which carriers say “No” to shipments tendered to them.
Rejection of refrigerated shipments (white line, Figure 2.1) continue to lead the way, just over 14 percent. Flatbed rejections come next, with a rate of just under 13 percent (yellow line). And van shipments (blue line) are being rejected, just under seven percent.
Keep in mind that while flatbed and reefer shipments are relatively high, van freight still claims the top spot for volume in the U.S.
Shippers need to be plugged into the ebb and flow of the rejection rates, as this will show itself in the spot market.
Imports Hit Snooze
Finally, ocean imports continue to lag volumes seen over the past few years (Figure 3.1). A slight bump in the coming weeks is likely, but retailers particularly continue to burn down inventories that bulged in the middle of this year.
Most likely we will not see a surge in import activity until late February, early March.
Stay Up To dAte
Looking for a more frequent update? Subscribe to our newsletter and receive the top five logistics articles of the week every Friday morning by selecting “Weekly News Update” when you select your preferences.
Get Weekly News Updates in Your InboxStay up to date on the latest information on conditions impacting the freight market, curated by Trinity Logistics through our Freightwaves Sonar subscription.
Cooling Temps & Tightening Capacity
It is getting closer to that time of the season. No, we’re not talking about turkeys and the little jolly man in the red suit; we’re talking about carriers uttering the “NO” word more often.
Typically, we see rejections elevate towards the end of the calendar year, and this year the trend is continuing.
Figure 1.1 shows the steady climb up and to the right for the overall rejection rate (blue line), but what is a bigger driver of that overall rate is the rejection seen with reefer shipments (gray line). Rejections of reefer shipments currently sit just above 15 percent. Conversely, rejection rates with van shipments (green line) have held relatively steady, hovering just above five percent.
Shippers should be prepared for rejection rates on refrigerated shipments to climb even higher as end of the year demand for temperature-controlled products (we all love our shrimp trays this time of year) and colder weather necessitating protection from freezing will help to elevate volumes against a backdrop of, at best, steady capacity.
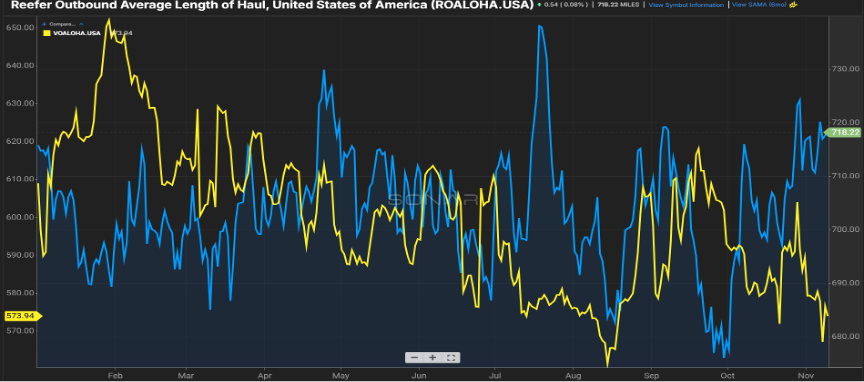
Haul Length Tell the Story
Also interesting is the length of haul for reefer versus van shipments.
As 2.1 illustrates, refrigerated shipments have seen the miles traveled increase by almost 40 miles compared to a month ago, while van shipments continue to get shorter, some 50 miles less than where they trended in the first quarter of this year.
Typically, van trailers are used for retail and consumer goods, as well as finished goods transportation.
Well, there’s no doubt the American consumer continues to support the retail and consumer goods side. However, this benefits more of the shorter-type freight moves versus longer haul (think anything 800 miles or more) as companies like Amazon, Target, Walmart, etc. have strategically placed their distribution centers to be within one-day transit of almost the entire U.S.
We have consistently seen the manufacturing, housing, and industry struggle in 2025.
These verticals support more of that over-the-road, multi-day transit freight. It’s no surprise that shipments of this length are down 25 percent versus a year ago. Carriers typically migrate toward shipments that keep them on the road for several days versus a new shipper and/or receiver each day, making long-haul shipments an advantageous carrot to dangle especially with spot shipments.
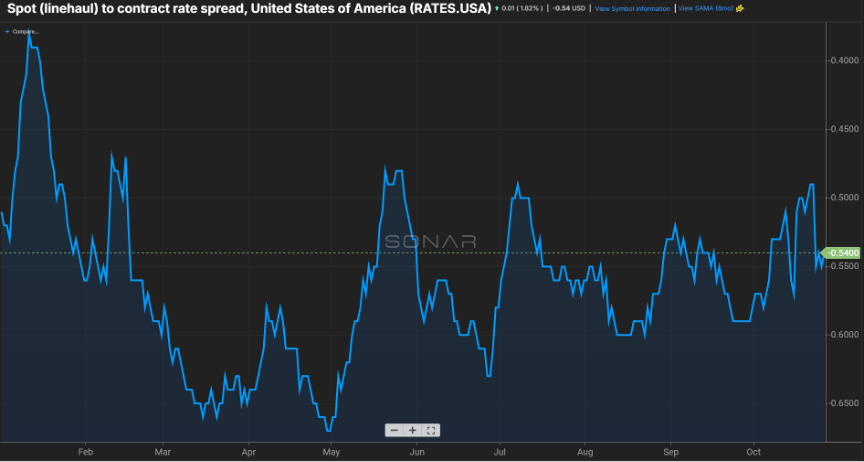
Bid Season Buzz
Lastly, bid season is upon us.
In anticipation of rates inching higher in 2026, shippers have hit “send” on those emails requesting pricing for the next six to 12 months.
Currently, the spread of spot versus contract pricing has hovered in the $0.50”ish” per mile (Figure 3.1).
With capacity expected to further dwindle due to rising costs for operating and regulatory constraints, along with the barrier of entry into the carrier market being more challenging, a more balanced supply and demand will boost rates on the spot market.
Many, from carriers to shippers to brokers, will be carefully consulting their crystal ball over the next few months.
Stay Up To dAte
Looking for a more frequent update? Subscribe to our newsletter and receive the top five logistics articles of the week every Friday morning by selecting “Weekly News Update” when you select your preferences.
Get Weekly News Updates in Your InboxStay up to date on the latest information on conditions impacting the freight market, curated by Trinity Logistics through our Freightwaves Sonar subscription.
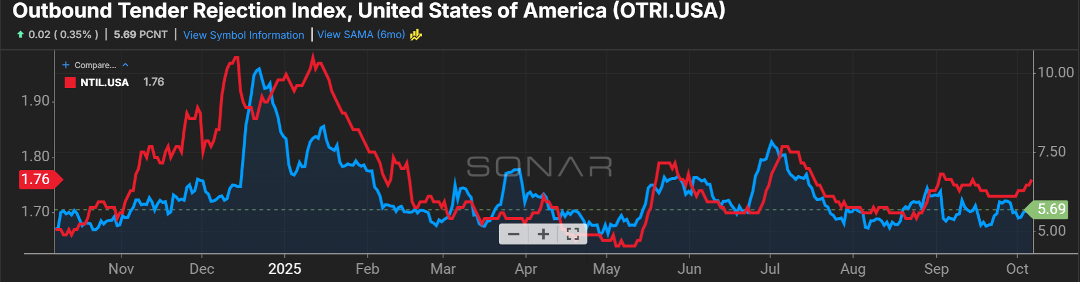
Capacity Could Face Its Next Test
I am not sure if the right amount of attention was paid to the recent announcement by Secretary Duffy at the end of last month around non-domiciled CDL’s. It’s anticipated that this will have a larger impact on the owner-operator and small fleet community, more than the larger fleets. Non-domiciled CDL drivers tend to sustain on a lower-than-average cost of living, making it palatable for carriers to accept at or below-market pricing for hauling shipments. This has the potential to push rejection rates and carrier rates higher as we close out 2025 and head into 2026, as it’s anticipated that over 100,000 drivers could be impacted.
While the impact of current drivers will not be immediately felt, since there is a two-year grace period, it will certainly restrict any new drivers looking to enter the over-the-road market. One of the best measurements of this will be seen in the tender rejection rate and national truckload rate index as seen in Figure 1.1. A driver loss of this size will certainly bring the use of autonomous trucks back into the conversation.
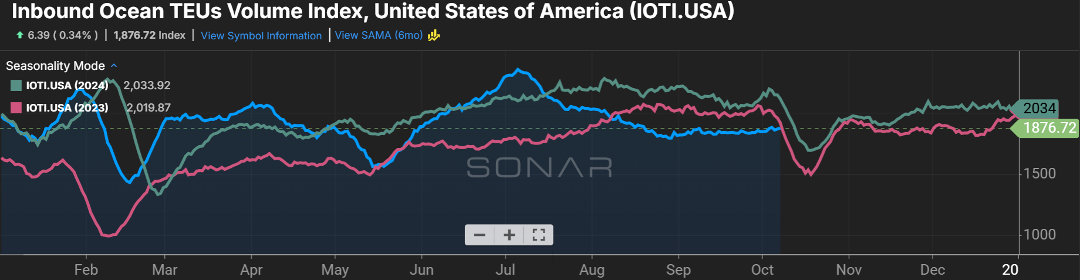
No Holiday Bump in Sight
For those keeping an eye on inbound ocean volumes, don’t expect a surge any time soon, certainly not before the close of 2025. Import volumes continue to trend below the last few years (Figure 2.1), and the flatline will likely dip slightly in the next several weeks before steadying as we head into 2026. Even a push in holiday consumer spending is not likely to dent depressed volumes at our major U.S. ports.
Stay Up To dAte
Looking for a more frequent update? Subscribe to our newsletter and receive the top five logistics articles of the week every Friday morning by selecting “Weekly News Update” when you select your preferences.
Get Weekly News Updates in Your Inbox