
03/18/2025 by Greg Massey
March 2025 Freight Market Update
Stay up to date on the latest information on conditions impacting the freight market, curated by Trinity Logistics through our Freightwaves Sonar subscription.
Spring Thaw or Economic Chill? Key Indicators to Watch in 2025
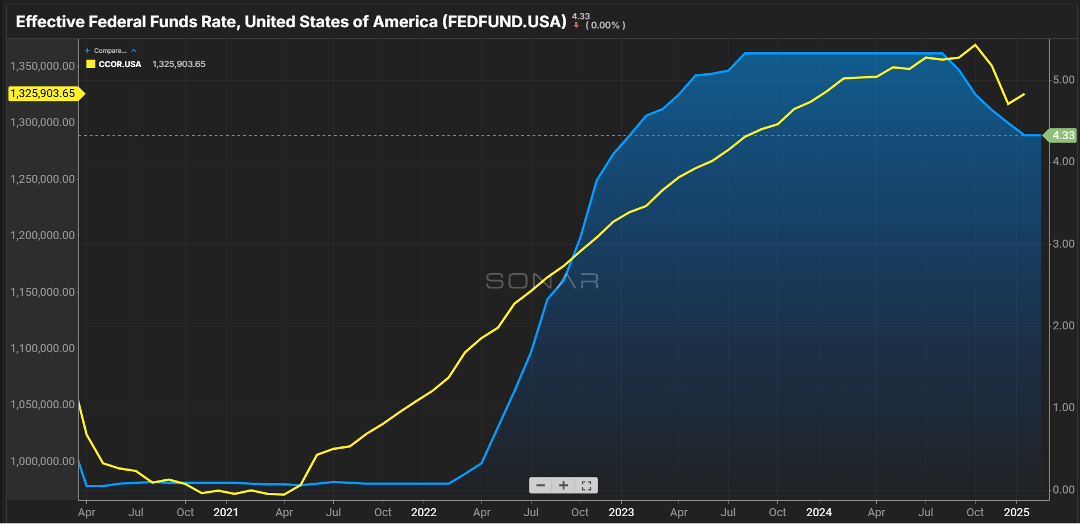
Normally we look at over-the-road or port volumes, what carrier rejections look like, and how that is impacting freight rates. This month, we’re going to shift a bit and look at things from more of an economic standpoint. The first chart, Figure 1.1, shows the federal funds rate and consumer debt. Consumer spending accounts for a large portion of GDP with dollars they spend on things as well as services.
The latter part of 2024 saw multiple cuts to interest rates. However, the expectation heading into 2025 was that any relief on rates would not be seen until the second half of the year as typically those who make the decisions take a bit of a ‘wait-and-see’ approach as there were several new players on the committee in their first meeting.
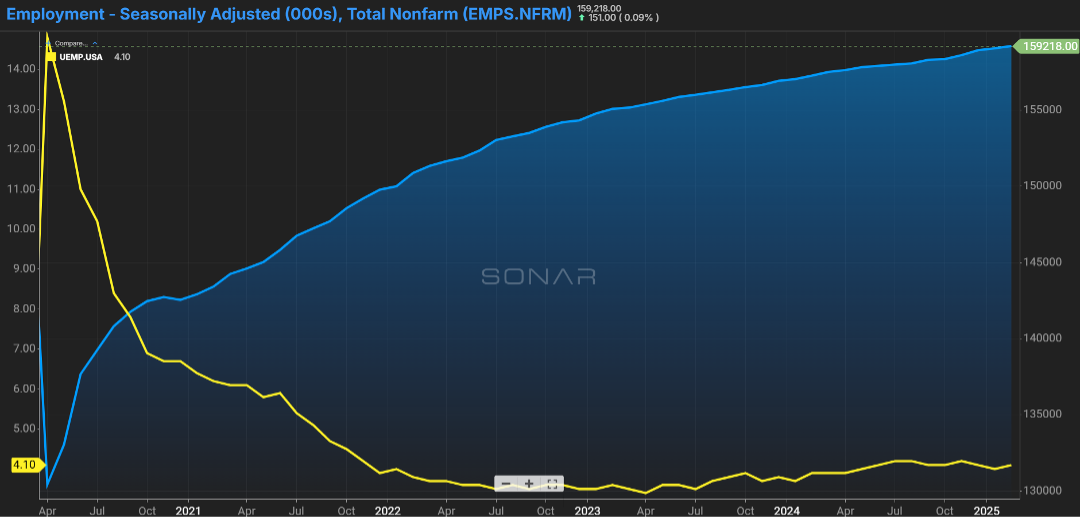
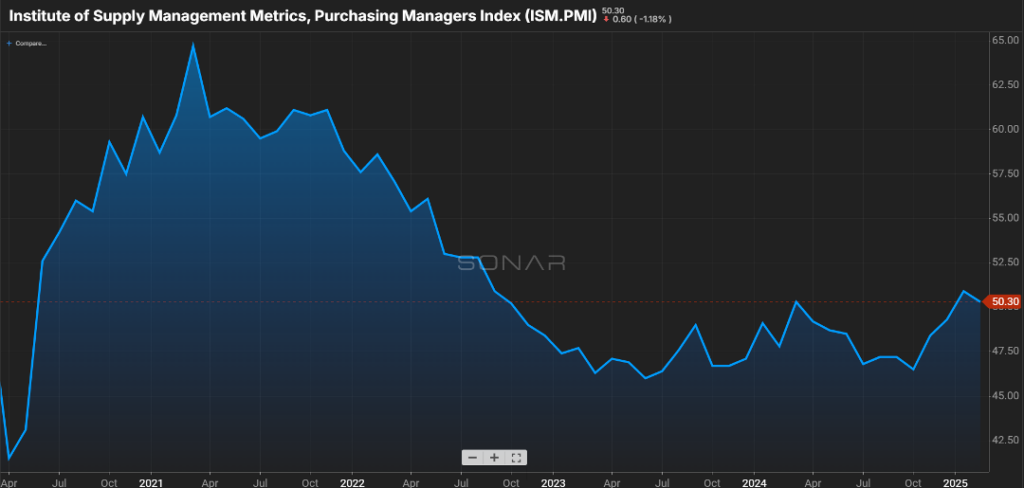
One area that members of the committee look toward is the strength of the labor market. While the jobs report showed numbers for the first two months of the year slightly below the forecast, the unemployment rate continued to hover in the 4% range (Figure 2.1). Another encouraging sign is the slight increase in jobs across the manufacturing and construction sectors. Coupled with the ISM breaching the 50 mark, which is typically the point of determining positive versus negative sentiment in these industries, there is optimism as the Spring thaw begins (Figure 2.2).
I would be remiss if I did not mention recently enacted and pending tariffs. I think anyone that gives an update on the economy is now required to mention the “T” word. Things like steel, aluminum, and lumber that have been at the center of these talks are commodities that support manufacturing, and a decline in volume or an increase in the cost of these goods could hamper the manufacturing sector.
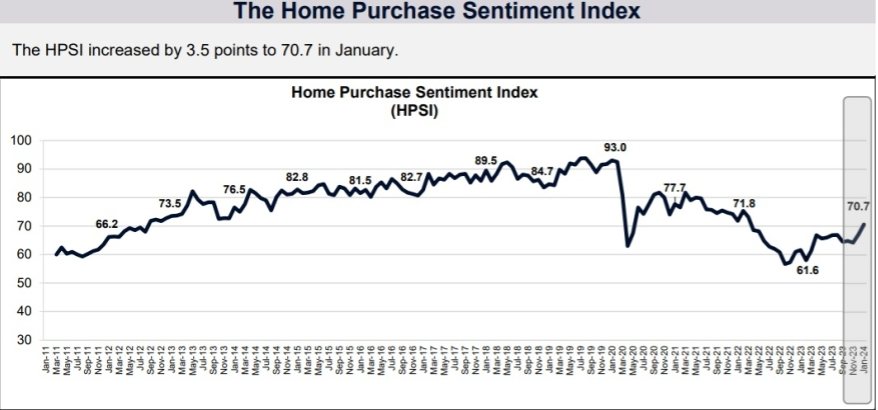
Another area in the news relates to home purchasing. Fannie Mae publishes the Home Purchase Sentiment Index, (Figure 3.1) which has shown a slight uptick in the last several months. Consumers who felt now was a good time to sell a home rose to 65 percent, up from 60 percent in January.
While the same cannot be said for those in the market to buy; only 19 percent of consumers felt it was a good time to buy., a modest increase from the end of 2024. Much of that optimism is based on anticipated relief with mortgage rates, something consumers believe the second half of the year will offer. Will we see rates of three percent that existed back in ’21 & ’22? Most likely, no, but rates in the five or six percent range can be a swing of several hundreds of dollars on a family’s monthly mortgage payment.
Stay Up To dAte
Looking for a more frequent update? Subscribe to our newsletter and receive the top five logistics articles of the week every Friday morning by selecting “Weekly News Update” when you select your preferences.
Get Weekly News Updates in Your Inbox