
04/17/2023 by Greg Massey
April 2023 Freight Market Update
Stay up to date on the latest information on conditions impacting the freight market, curated by Trinity Logistics through our Freightwaves Sonar subscription.
SIMPLE SUPPLY AND DEMAND
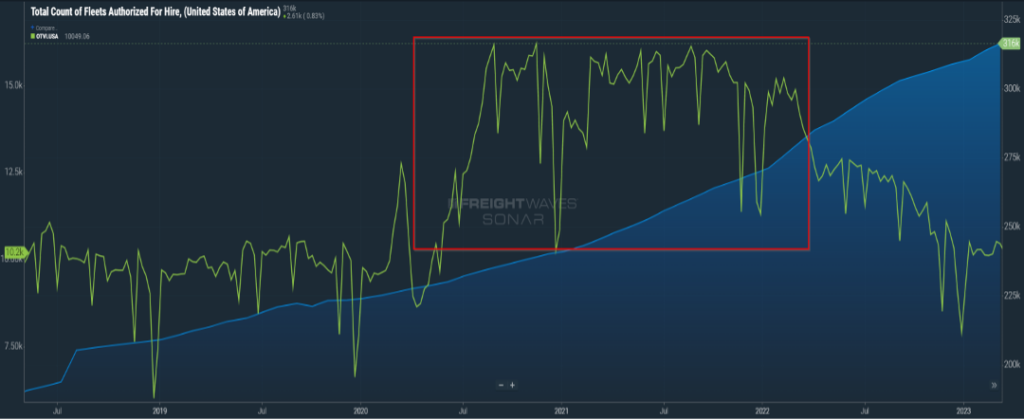
We probably all remember at some point in either our high school or college career hearing about supply and demand. A pretty simple concept that applies to goods, commodities, services, and yes, transportation. A great indicator of that is shown in Figure 1.1 which shows the growth in for-hire carriers (blue line) and the outbound tender volume index (green) since mid-2018. While this is not a 1:1 comparison, it clearly shows, especially in the past three years, how supply and demand have been the driver of transportation costs.
From roughly mid-2020 until the early part of 2022, demand was high compared to prior years, and the supply side (carriers) was trying to catch up. As a result, carriers were able to dictate rates in the market. As the supply side began to accelerate, the over-heated freight market began to normalize in late 2021/early 2022, retreating to levels seen prior to the pandemic. The rate pendulum once again swings to the shipper’s side. Some have argued based on this over-capacity situation that it could take years before there is once again equilibrium. Agree, it will take, unfortunately, attrition on the carrier side, combined with a rebound on the freight activity side to find that balance. However, taking years to do so is a bit aggressive. Most likely, mid-2024 will see supply and demand as it relates to transportation reaching a better balance.
THE GAP
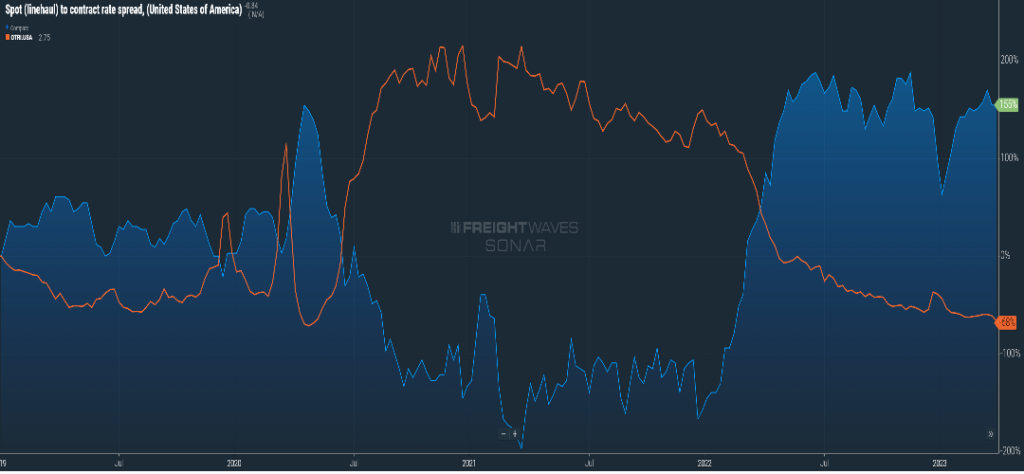
We looked at this last month, but the lag between spot and contract rates remains at historic levels. Typically, you will see a gap of maybe 10 cents or 15 cents per mile, but for the last five months, that gap has remained above the $0.50 per mile mark, currently trending at $0.86 per mile higher on the contract versus the spot side.
As you can see in Figure 1.2, that increase in the contract-to-spot gap has been in lockstep with the decreasing outbound tender rejection rate. As carriers with contract pricing are finding fewer freight opportunities versus 2021 and 2022, they are taking almost every shipment tendered their way. On average, for every 100 contracted shipments tendered to carriers, they accept 97 of those shipments. For shippers, it will be a balance between finding cost savings with spot capacity and fulfilling the requirements they have with higher-priced contracted carriers.
BLAH IMPORT CONDITIONS
On the international side, particularly imports, we continue to see declining volumes and blank sailings. While the ports were inundated in late 2020 through the first half of 2022, that volume has stalled. Stalled to the point where the largest U.S. port of LA/LB encountered almost 100 ships at one point waiting to offload to now having “plenty of good parking spots available.”
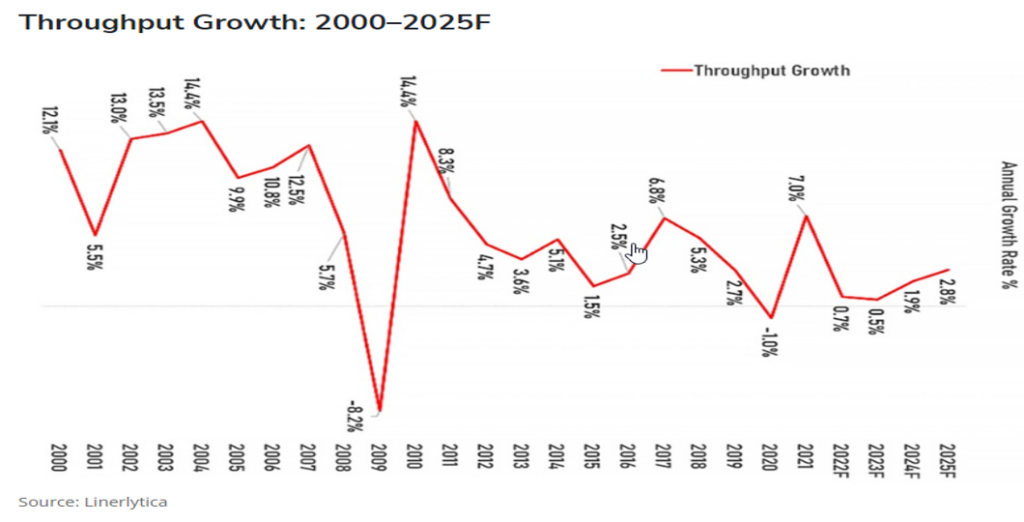
Figure 1.3 clearly demonstrates the decline in consumer demand, along with near-shoring efforts, and the year-over-year impact. Expect, for lack of a better word, blah import conditions throughout 2023 with a rebound on the horizon for ’24 and ’25.
Stay Up To dAte
Looking for a more frequent update? Subscribe to our newsletter and receive Weekly News Updates every Friday by selecting “Weekly News Update” when you select your preferences.
Join Our Mailing List for Frequent News Updates