
11/17/2026 by Amanda Lloyd
November 2026 Freight Market Update: Rethinking Transportation Budgets for 2027
What assumptions are shaping your 2027 transportation budget?
If you’re expecting softer freight demand and improving carrier acceptance to bring transportation costs down, November’s data offers a reason to revisit those expectations.
National tender rejection rates have declined, diesel prices have fallen below $6 per gallon, and freight volumes remain relatively steady. Yet spot linehaul rates have increased, and reported contract pricing remains elevated.
As transportation leaders finalize budgets and prepare for annual freight bids, understanding these market shifts is particularly important.
November Freight Market Snapshot
Here are the key numbers shaping the freight market this month:
| Market Indicator | Latest Reading | What It Tells Us |
|---|---|---|
| National Tender Volume (OTVI) | 9,610 | Relatively unchanged from October |
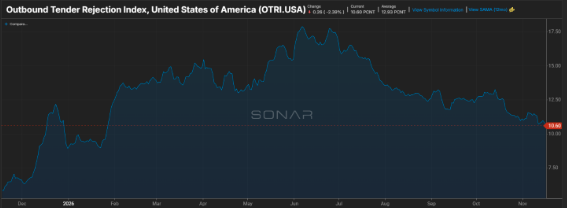
| National Tender Rejections (OTRI) | 10.60% | Carrier acceptance has improved |
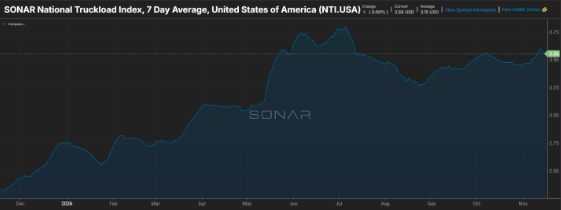
| All-In Truckload Spot Rate (NTI) | $3.56/mile | Up 1.1% from October’s snapshot |
| Linehaul-Only Spot Rate (NTIL) | $2.58/mile | Up 3.2% from October’s snapshot |
| Van Contract Base Rate | $2.79/mile | Latest final reported rate remains elevated |
| National Diesel | $5.937/gallon | Below $6 per gallon |
| October Logistics Managers’ Index | 70.7 | Continued strong logistics expansion |
Sources: FreightWaves SONAR, U.S. Energy Information Administration (EIA), and October 2026 Logistics Managers’ Index. SONAR readings reflect mid-October snapshots. The LMI reflects September survey conditions.
Carrier Acceptance Is Improving
One of November’s most encouraging developments is the improvement in carrier acceptance.
National tender rejection rates have declined from 13.27% in October to 10.60%, falling below their one-year average of 12.93%.
At the same time, national tender volumes remain relatively unchanged. The Outbound Tender Volume Index (OTVI) currently sits at approximately 9,610, nearly 7% below its one-year average.
While carriers are accepting a greater share of contracted freight than they were a month ago, rejection rates remain considerably higher than they were at this time last year.
What This Means For Shippers
This is an opportunity to evaluate routing guide performance and identify Improving carrier acceptance doesn’t necessarily mean every lane is becoming easier or less expensive to cover. National trends can mask meaningful differences by region, equipment type, and shipping patterns.
For shippers, this is an opportunity to evaluate routing guide performance, identify where reliance on backup capacity may be decreasing, and determine which lanes may require a different approach heading into 2027.
1 Year Trend
Source: FreightWaves SONAR
The Cost of Moving Freight Remains Elevated
While carrier acceptance has improved, spot pricing has moved in the opposite direction.
The SONAR National Truckload Index (NTI), which includes fuel, has increased from $3.52 per mile in October to $3.56.
More notably, linehaul-only spot rates have increased 3.2%, reaching $2.58 per mile and remaining nearly 9% above their one-year average.
The latest final reported van contract base rate stands at $2.79 per mile, also above its historical average.
What This Means For Shippers
This is particularly relevant for shippers preparing annual freight bids.
Recent improvements in carrier acceptance should be considered alongside current pricing benchmarks, rather than viewed as an indication that lower contract rates will follow.
1 Year Trend
Source: FreightWaves SONAR
Fuel Costs Provide Some Relief
Diesel prices are moving in a more favorable direction.
According to the U.S. Energy Information Administration, national diesel prices declined to $5.937 per gallon for the week of November 16, down more than 35 cents since the beginning of the month.
However, diesel remains approximately $2.07 per gallon higher than a year ago.
Regional differences also remain significant. Gulf Coast diesel averaged $5.547 per gallon, compared with $7.733 in California.
What This Means For Shippers
With diesel prices declining while spot linehaul rates increase, separating fuel and base transportation costs will be especially important when developing 2027 budgets.
Inventory Growth Deserves Attention
The October Logistics Managers’ Index (LMI) offers additional insight into broader supply chain conditions.
The overall index reached 70.7, indicating continued strong growth in logistics activity.
Inventory Levels increased from 58.9 in September to 66.9 in October, while Inventory Costs climbed to 88.8.
Transportation Capacity continued to contract, although at a slower rate, and Transportation Prices continued to expand.
These readings measure the direction and breadth of change among survey respondents, rather than percentage changes in actual costs or capacity.
Whether the recent inventory buildup translates into sustained freight demand remains a development worth monitoring as we approach the end of the year.
3 Questions to Ask Before Finalizing Your 2027 Transportation Budget
November’s market conditions provide a useful opportunity to challenge existing planning assumptions.
Are your pricing expectations based on current market conditions? Compare existing contract rates with current lane-level benchmarks rather than relying solely on historical pricing.
Where can improved carrier acceptance reduce costs? Review routing guide performance, tender failures, and unplanned spot market spending to identify opportunities within your network.
Have you separated fuel and linehaul assumptions? These costs are currently moving in different directions and should be evaluated independently.
What We’re Watching Next
As 2026 comes to a close, we’ll be monitoring:
- Whether carrier acceptance continues improving through the holiday season.
- Whether spot linehaul pricing maintains its recent upward movement.
- Whether inventory growth translates into stronger truckload demand.
These developments will help shape our understanding of the freight market entering 2027.
Looking Ahead
The transportation market entering 2027 looks different from the one shippers experienced a year ago.
Improving carrier acceptance offers opportunities to strengthen transportation network performance, but elevated rates and fuel costs remain important budget considerations.
The most valuable transportation strategy for 2027 may not be the one that predicts the market correctly, but the one that can adapt when the market behaves differently than expected.
Don’t Let Market Shifts catch you off guard
Freight conditions can shift quickly and have a major impact on your transportation strategy. Subscribe to receive our monthly Freight Market Update in your inbox and also have the option to receive our Weekly News update for a quick Friday morning snapshot of what’s shaping the market.
Don't Miss the Next One – Sign UpPlanning Your 2027 Transportation Strategy?
Freight market conditions can shift quickly, and national averages don’t always reflect what’s happening across your specific lanes. Trinity Logistics works with shippers to evaluate transportation challenges, identify opportunities, and build flexible freight strategies.
Connect with our team to discuss what current market conditions could mean for your transportation network.
Quote Your Next Shipment With TrinityMarket data sourced from FreightWaves SONAR, the Logistics Managers’ Index, and the U.S. Energy Information Administration. Market conditions and index values reflect the latest available data at the time of publication and are subject to change.