Stay up to date on the latest information on conditions impacting the freight market, curated by Trinity Logistics through our Freightwaves Sonar subscription.
UP AND TO THE RIGHT
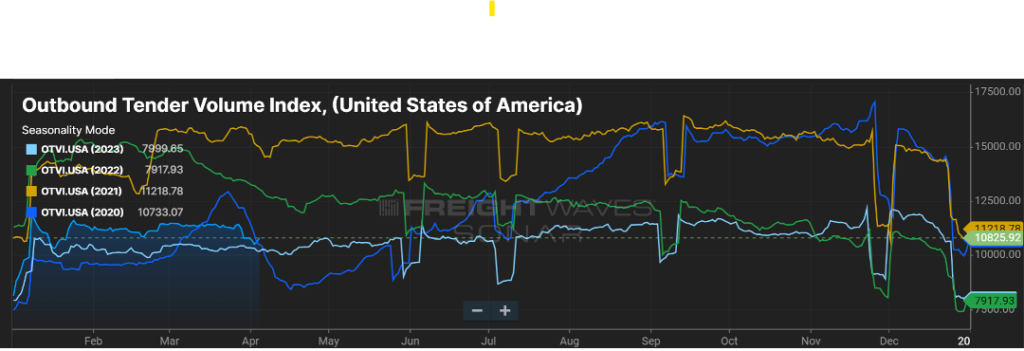
For the past year, the general direction of the Outbound Tender Volume Index (OTVI) has been on an upward trajectory as seen in Figure 1.1.

While it is not approaching the levels seen in 2021, the volume index is quickly approaching levels seen in 2022. This has buoyed optimism in the industry.
Another rise we’re keeping an eye on is the Outbound Tender Rejection Index, the rate at which carriers are saying “no” to freight where they have paper rates with a shipper. A six percent rejection rate may not sound important, but considering the rejection rate has stagnated in the three-to-four percent range for the past year plus, it’s another sign that the freight pendulum may be nearing more of a balanced market.
In 2021, rejection rates hovered in the 20-30 percent range. This was more a product of increased freight volumes and carriers realizing they could get higher rates in the spot market versus the contracted rates they had in place. The uptick in rejection now appears to be more of a limit of capacity in certain markets versus carriers hedging their bets on the open load board.
Drip, Drip, Drip
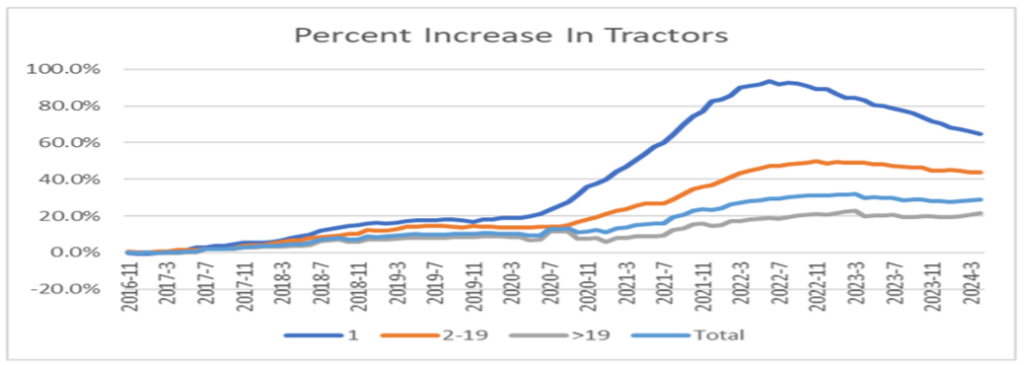
Speaking of that capacity, there is a reduction happening, albeit a slow drip. As shown in Figure 1.2, for the past year and a half, almost two years, the biggest reduction in capacity has been from the owner-operator segment. Most likely, the carriers in this group that have exited the market are those that rushed in when freight and rates were plentiful, and now are finding more normalized rates combined with high overhead to be unsustainable.
As shippers continue to look ahead, not having reliability among this segment of carriers could prove problematic as volumes escalate and more freight flows to the spot market, which is supported heavily by owner-operator drivers. This is a good reason for shippers to ensure they have a good mix of carrier and broker partners.

Baltimore Still Recovering
Finally, it has been just over three months since the bridge collapsed near Baltimore, MD. The waterways in the surrounding area appear to be returning to normal, and the need for traffic that populated the bridge to divert to alternate routes seems to be no worse for the wear on drivers.
Looking at volume in that market in Figure 1.3 since the end of March when the event occurred, after a slight dip when freight had to be re-routed, volumes as measured by the OTVI have increased just over 10 percent. Certainly, there is still work to be done, short- and long-term, but the Baltimore area appears to have powered through an unfortunate event.

Stay Up To dAte
Looking for a more frequent update? Subscribe to our newsletter and receive the top five logistics articles of the week every Friday morning by selecting “Weekly News Update” when you select your preferences.
Get Weekly News Updates in Your InboxStay up to date on the latest information on conditions impacting the freight market, curated by Trinity Logistics through our Freightwaves Sonar subscription.
A LOOK AT THE PAST AND FUTURE OF THE FREIGHT MARKET
The Outbound Tender Volume Index (OTVI) measures the volume of contracted freight in the U.S. While this does not account for the spot market, ebbs and flows in contract freight have a direct impact on spot market volume and pricing. The outlier on the graph below (Figure 1.1) is the yellow line, representing calendar year 2021. This was an unprecedented year for freight volume, primarily influenced by consumer spending. While many feel the freight market is suppressed, that is not necessarily the case. 2024 will follow a more traditional freight flow pattern, with volumes up five to eight percent, year-over-year (YoY).

Measuring the freight volume is not enough to predict swings in pricing. Being able to overlay the frequency in which carriers say “no” to freight tenders via the Outbound Tender Rejection Index (OTRI) gives a good picture whether the capacity side of the market can handle those swings.
The below chart (Figure 2.1) looks at the amount of contracted freight volume (blue line) with the frequency of tender rejections (green line) overlayed. As can see, most of 2019 and the first part of 2020 saw a market where freight volumes were easily handled. This was a result of lower than anticipated freight volumes versus a glut of carriers in the market.

Then March 2020 happened. Everything went on lockdown. Volumes and rejection rates plummeted. That was quickly followed by a freight injection and for the latter part of 2020, and all of 2021, the market struggled with a lack of capacity to handle the record freight volumes.
For example, most LTL carriers were operating at 105-107 percent of capacity when they normally are in the low to mid-90s range. The freight market pendulum was in favor of the carriers. When the market gets hot, everyone wants in, which is what was happening in 2021, and 2022 – new carriers raced to get in on the action while existing carriers looked to soak up as much rolling stock as they could to capitalize on the market.
2023 saw a return to more traditional levels, but the capacity remained. As a result, rejection rates for freight tenders took a dive to below five percent, indicating carriers were eager for any freight that kept their fleets moving. This caused freight rates to take a dive (Figure 3.1) and then stabilize as of late.

But how long will shippers be able to rely on rate stability? Most likely the best determination will be the pace at which carriers exit the market.
Figure 4.1 clearly shows capacity has been coming out of the market (blue line) for the past year. Most of that capacity is small – micro-fleets and owner operators. Certainly, this is dwindling capacity, but not to the extent of a large carrier pulling out of the market. A slow drip for sure.
The orange line represents the OTVI (volume) in the market, and that has slowly climbed over the last 12 months with the normal seasonal up and downs. At some point, as the volume inches up and capacity comes down, it’s simple supply and demand. Many are pointing to the end of this year, more likely spring of 2025 when that balance starts to shift. Now is the time for shippers to learn the contingency plans that are in place with their carrier and broker providers to account for this.

Stay Up To dAte
Looking for a more frequent update? Subscribe to our newsletter and receive the top five logistics articles of the week every Friday morning by selecting “Weekly News Update” when you select your preferences.
Get Weekly News Updates in Your InboxStay up to date on the latest information on conditions impacting the freight market, curated by Trinity Logistics through our Freightwaves Sonar subscription.
FREIGHT VOLUMES ARE ACTUALLY UP
It seems much of the news clippings have been around freight rates and how they remain suppressed. One could jump to the conclusion that this is a result of freight volumes being down. On the contrary, freight volumes are elevated from what we saw in 2023.
As you can see in Figure 1.1, volumes for the majority of 2024 are between six to eight percent higher compared to 2023. What is driving (or not driving) rates remains the capacity in the market.

Capacity is showing a net decline, albeit slower than expected. Much of that reduction is being felt in the less-than-10 tractor-fleets, so while the number of for-hire carriers is declining, the impact to actual trucks to haul freight is a slow drip.
That capacity continues to hold tender rejection rates at extremely low levels, meaning few loads are hitting the spot market. As a result, spot rates remain almost $0.70 per mile less than contracted rates. There has been some closing of the gap over the past year, as shown in Figure 1.2, but look for the gap to remain relatively consistent for the remainder of the year.

The Aftermath of The Francis Scott Key Bridge Collapse
It has been about six weeks since the bridge collapse in Baltimore. Removal efforts continue and certainly, a return to normal traffic flow is years away.
In positive news, looking at the *headhaul index for that market (Figure 1.3), aside from the drop around the time of the collapse, things appear to be back to normal from a balance standpoint. Certainly, there are more out-of-route miles and freight that may be entering at nearby ports, but for the most part, outbound and inbound freight volumes appear to be back to normal for the Baltimore market.
*headhaul measures the variance in outbound versus inbound freight

Stay Up To dAte
Looking for a more frequent update? Subscribe to our newsletter and receive the top five logistics articles of the week every Friday morning by selecting “Weekly News Update” when you select your preferences.
Get Weekly News Updates in Your InboxStay up to date on the latest information on conditions impacting the freight market, curated by Trinity Logistics through our Freightwaves Sonar subscription.
FRANCIS SCOTT KEY BRIDGE IMPACT
Watching the video of the bridge collapse was surreal. To have that structure there one minute, then five seconds later be completely gone, was jaw-dropping. Certainly, our thoughts and prayers are with those whose lives were impacted by the collapse.
Since the incident, clean-up has begun and a temporary waterway has been established, but it will take a while for the port to fully recover, let alone the bridge itself to be rebuilt. While the 30,000 plus vehicles that regularly cross that bridge is a sizable number, it’s about one-sixth of the volume that uses nearby major thoroughfares like I-695 or I-95 in the Baltimore area. Still, that traffic will need to go somewhere.
From the trucking side, there will likely be two main areas of impact. First, local freight that is destined for ocean travel will now need to find another port of departure, likely destinations the ports of NJ/NY; Philadelphia; and Norfolk, VA. This means more freight will be heading out of the Baltimore area.
Figure 1.1 below shows that since the end of March, right around the time of the bridge collapse, outbound volume, and freight tender rejection rates, have trended upward. Second, freight that travels around the Baltimore area will likely incur more out of “normal” route miles if the bridge was part of its route.
More carrier miles = more time to deliver = less time for other freight = increased freight costs.

SOME BALANCE SEEN
Overall, freight volumes have trended slightly above 2023 (Figure 2.1).
This has not dramatically impacted freight rates nationally or freight tender rejection rates. Excess capacity continues its slow runoff, and March saw an uptick in for hire carriers.
On a more granular scale, flatbed freight seems to be more optimistic. As seasonal flatbed type freight, combined with an uptick in industrial production and manufacturing activity is occurring, it has pushed flatbed rejection rates to more normal levels over the past few months as seen in Figure 3.1.
Flatbed rejection rates reached their highest point in over a year recently, and a 15 percent rejection rate is indicative of a more balanced freight market, if only for a certain equipment type segment.


Stay Up To dAte
Looking for a more frequent update? Subscribe to our newsletter and receive the top five logistics articles of the week every Friday morning by selecting “Weekly News Update” when you select your preferences.
Get Weekly News Updates in Your Inbox