Stay up to date on the latest information on conditions impacting the freight market, curated by Trinity Logistics through our Freightwaves Sonar subscription.
FREIGHT VOLUMES ARE ACTUALLY UP
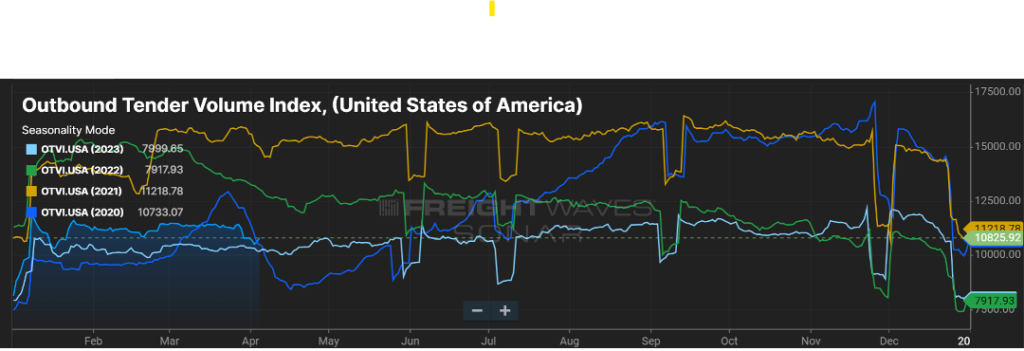
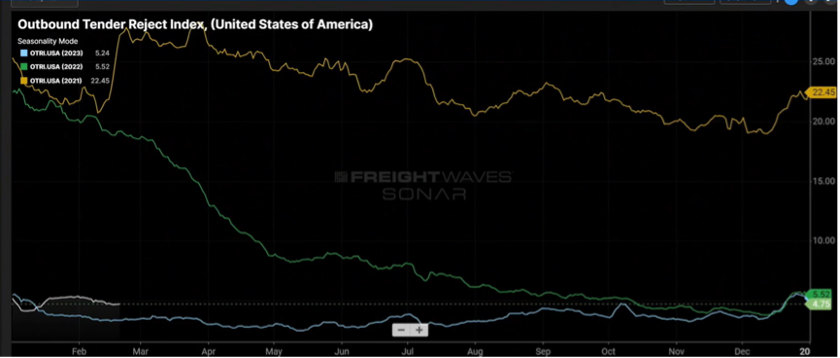
It seems much of the news clippings have been around freight rates and how they remain suppressed. One could jump to the conclusion that this is a result of freight volumes being down. On the contrary, freight volumes are elevated from what we saw in 2023.
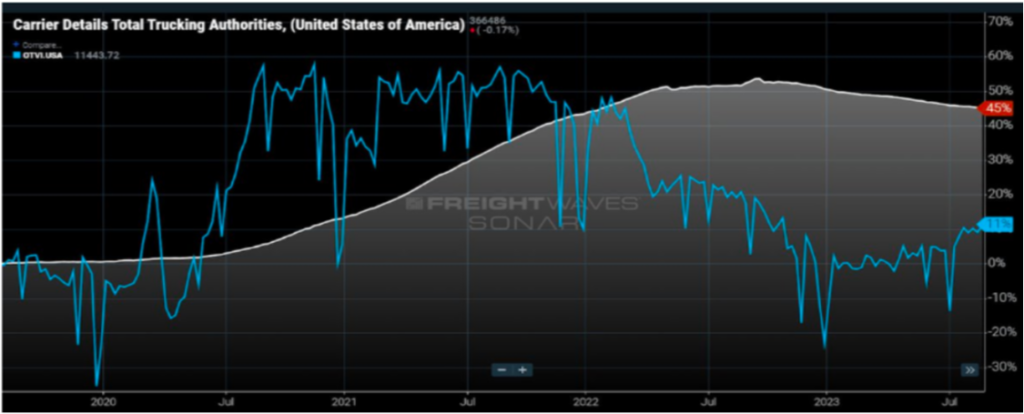
As you can see in Figure 1.1, volumes for the majority of 2024 are between six to eight percent higher compared to 2023. What is driving (or not driving) rates remains the capacity in the market.

Capacity is showing a net decline, albeit slower than expected. Much of that reduction is being felt in the less-than-10 tractor-fleets, so while the number of for-hire carriers is declining, the impact to actual trucks to haul freight is a slow drip.
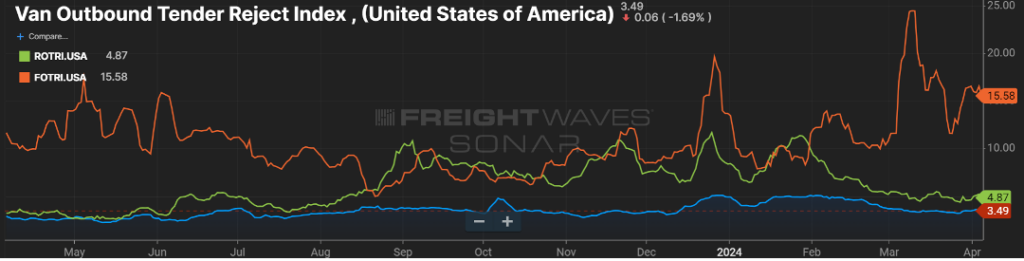
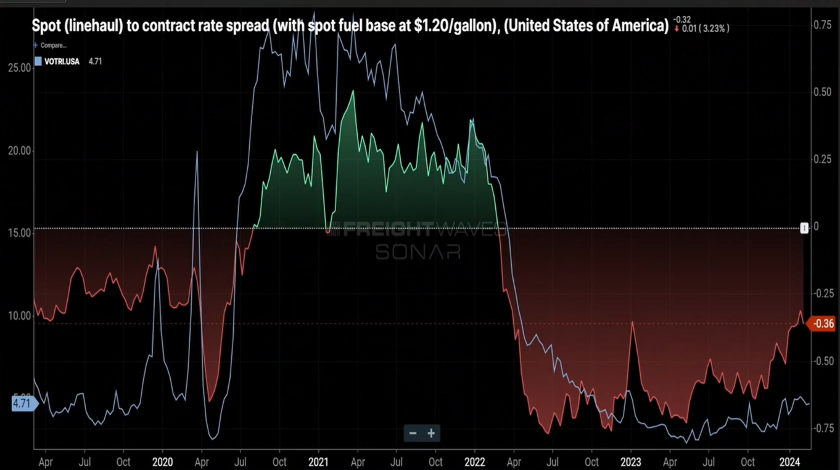
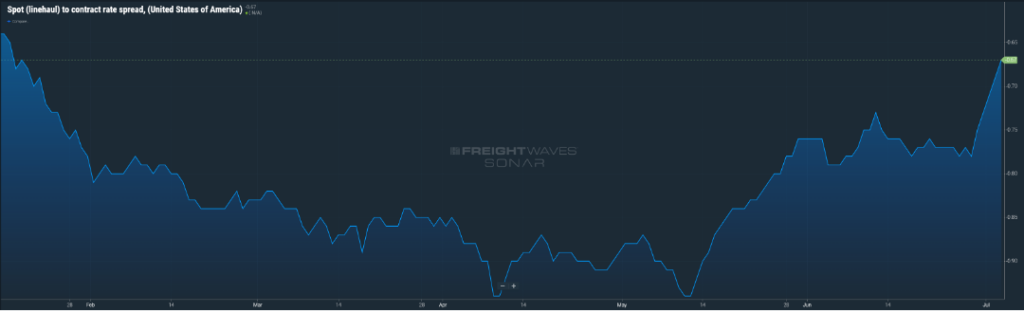
That capacity continues to hold tender rejection rates at extremely low levels, meaning few loads are hitting the spot market. As a result, spot rates remain almost $0.70 per mile less than contracted rates. There has been some closing of the gap over the past year, as shown in Figure 1.2, but look for the gap to remain relatively consistent for the remainder of the year.

The Aftermath of The Francis Scott Key Bridge Collapse
It has been about six weeks since the bridge collapse in Baltimore. Removal efforts continue and certainly, a return to normal traffic flow is years away.
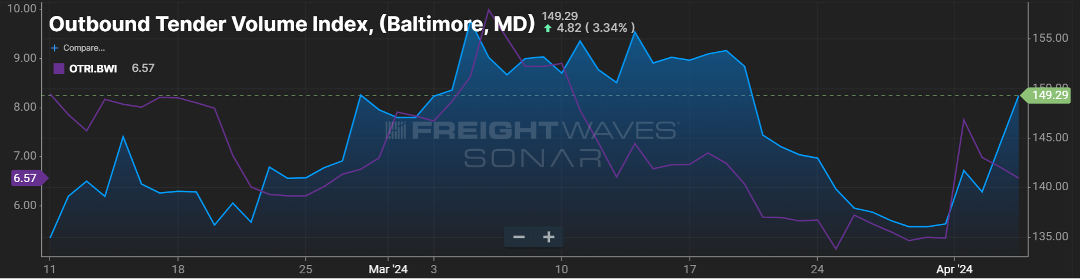
In positive news, looking at the *headhaul index for that market (Figure 1.3), aside from the drop around the time of the collapse, things appear to be back to normal from a balance standpoint. Certainly, there are more out-of-route miles and freight that may be entering at nearby ports, but for the most part, outbound and inbound freight volumes appear to be back to normal for the Baltimore market.
*headhaul measures the variance in outbound versus inbound freight

Stay Up To dAte
Looking for a more frequent update? Subscribe to our newsletter and receive the top five logistics articles of the week every Friday morning by selecting “Weekly News Update” when you select your preferences.
Get Weekly News Updates in Your InboxStay up to date on the latest information on conditions impacting the freight market, curated by Trinity Logistics through our Freightwaves Sonar subscription.
FRANCIS SCOTT KEY BRIDGE IMPACT
Watching the video of the bridge collapse was surreal. To have that structure there one minute, then five seconds later be completely gone, was jaw-dropping. Certainly, our thoughts and prayers are with those whose lives were impacted by the collapse.
Since the incident, clean-up has begun and a temporary waterway has been established, but it will take a while for the port to fully recover, let alone the bridge itself to be rebuilt. While the 30,000 plus vehicles that regularly cross that bridge is a sizable number, it’s about one-sixth of the volume that uses nearby major thoroughfares like I-695 or I-95 in the Baltimore area. Still, that traffic will need to go somewhere.
From the trucking side, there will likely be two main areas of impact. First, local freight that is destined for ocean travel will now need to find another port of departure, likely destinations the ports of NJ/NY; Philadelphia; and Norfolk, VA. This means more freight will be heading out of the Baltimore area.
Figure 1.1 below shows that since the end of March, right around the time of the bridge collapse, outbound volume, and freight tender rejection rates, have trended upward. Second, freight that travels around the Baltimore area will likely incur more out of “normal” route miles if the bridge was part of its route.
More carrier miles = more time to deliver = less time for other freight = increased freight costs.
SOME BALANCE SEEN
Overall, freight volumes have trended slightly above 2023 (Figure 2.1).
This has not dramatically impacted freight rates nationally or freight tender rejection rates. Excess capacity continues its slow runoff, and March saw an uptick in for hire carriers.
On a more granular scale, flatbed freight seems to be more optimistic. As seasonal flatbed type freight, combined with an uptick in industrial production and manufacturing activity is occurring, it has pushed flatbed rejection rates to more normal levels over the past few months as seen in Figure 3.1.
Flatbed rejection rates reached their highest point in over a year recently, and a 15 percent rejection rate is indicative of a more balanced freight market, if only for a certain equipment type segment.
Stay Up To dAte
Looking for a more frequent update? Subscribe to our newsletter and receive the top five logistics articles of the week every Friday morning by selecting “Weekly News Update” when you select your preferences.
Get Weekly News Updates in Your InboxStay up to date on the latest information on conditions impacting the freight market, curated by Trinity Logistics through our Freightwaves Sonar subscription.
WILL 2024 BE A FREIGHT REBOUND YEAR?
I certainly do not expect that we will return to freight volumes like we saw in 2021, and part of 2022. Now, I will never say never, but those were most likely once in a lifetime events. However, there are many signs that point to a potential for 2024 to see a rebound in freight volumes and carrier rates.
First, let’s talk about rates for over-the-road (OTR) carriers. Many new entrants came to the carrier market in ’21 and ’22, but currently, we’re seeing the contraction of for-hire carriers.
As shown in Figure 1.1, the past 14 months have seen less carriers in the market. As supply continues to dwindle, this will put upward pressure on rates. Granted, it may take another 12 months for the carrier market to find an economic balance.
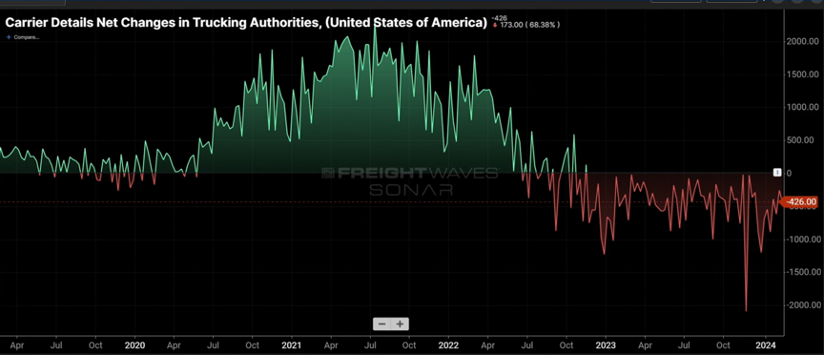
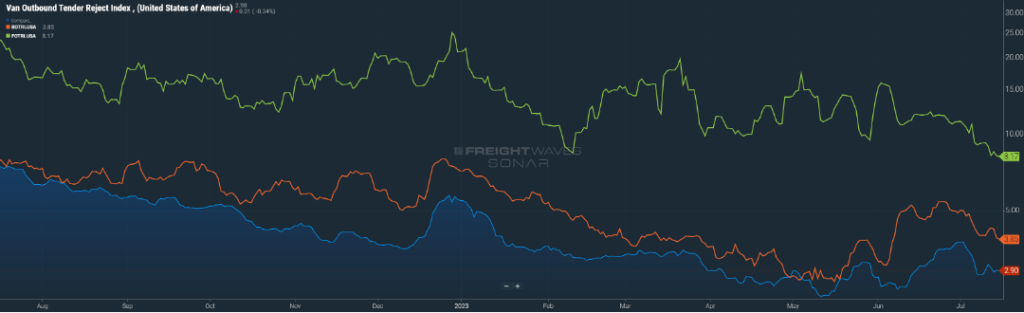
Figure 1.2 measures the rate at which carriers reject tenders (shipments) and continues to slowly climb upward. Granted, a rejection rate of five-plus percent is not earth-shattering, but in comparison to where it was in 2023, sub three percent in several months, five percent and the continuing upward movement is noticeable.
Lastly, Figure 1.3 shows that spot rates continue their slow rebound from the middle part of 2023. Contract rates throughout much of 2022 and half of 2023, were $0.60 to $0.70 cents per mile higher. Today, that gap stands at $0.36 per mile. This is a combination of spot rates inching higher, but also contract rates being less than prior years.
An Opportunistic Outlook
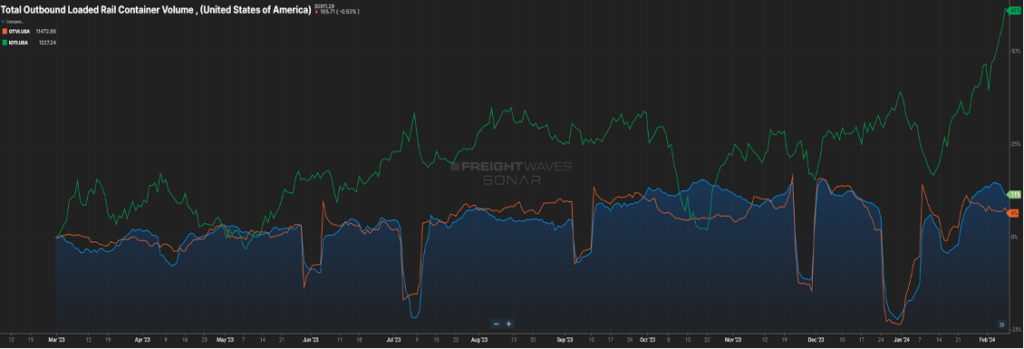
While contraction in the carrier market will influence the supply side of the economic equation, there also needs to be a demand component. The below chart (Figure 2.1) shows loaded rail car volume and over-the-road volume trending up and to the right, but the green line, representing inbound ocean containers, is really peaking.
Eventually, these containers will morph into rail and OTR volume. This is most likely a result in the drawing down of inventories, and the need for replenishment. Combine this with continuing increases in the manufacturing sector and housing market that will show better signs than 2023, it sets the stage for strong demand especially in the second half of 2024.
Will it be a bull or bear year in ’24? Well, if you would have asked that question six months ago, even maybe three months ago, my answer would have been slightly bearish or at best flat. However, seeing the recent signs on freight activity and the carriers needed to move this freight gives more reason to be optimistic as we go through the next ten months of the year.
Stay Up To dAte
Looking for a more frequent update? Subscribe to our newsletter and receive the top five logistics articles of the week every Friday morning by selecting “Weekly News Update” when you select your preferences.
Get Weekly News Updates in Your InboxStay up to date on the latest information on conditions impacting the freight market, curated by Trinity Logistics through our Freightwaves Sonar subscription.
COULD WE LOSE CARRIER CAPACITY….WITHOUT LOSING ACTUAL CAPACITY?
Certainly, this question could cause one to scratch his head. If we don’t have a decline in the number of operating authorities, or available trucks, then how could we lose capacity?
Well, technically, the answer is you would not be physically losing trucks. However, an impact could be felt from recent events with regards to container shipping that would make it feel like less trucks are available. With recent geo-political events, and events at home, shipping to the West Coast has become more feasible than it was a year, certainly two years, ago. As ocean carriers are mindful of events in the Red Sea, combined with an easing of labor tensions at the West Coast ports, freight that in prior years was diverted to the East Coast is now heading back to the left coast of our country.
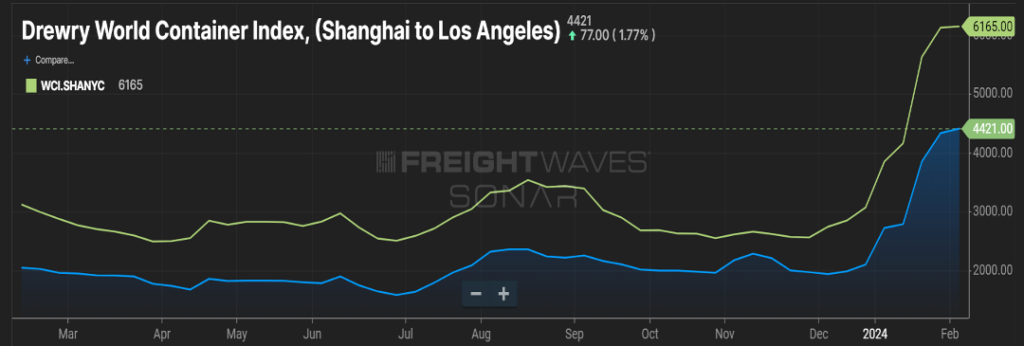
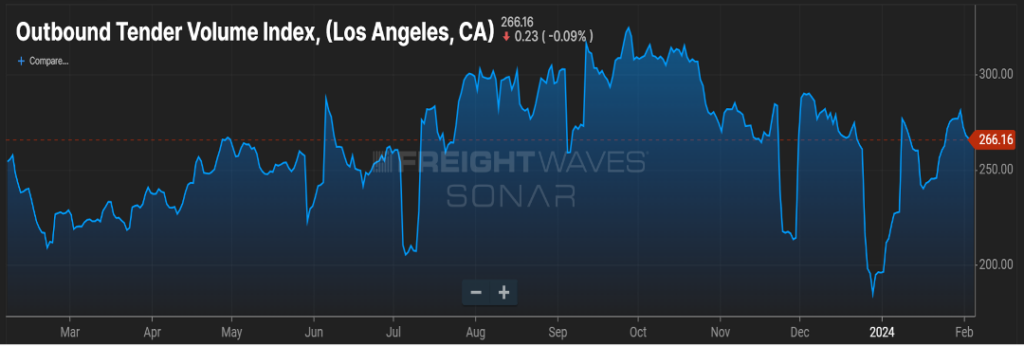
As you can see in Figure 1.1, container costs from Asia to Los Angeles are over $1700 cheaper than freight bound for an East Coast port, such as New York. Figure 2.1 shows outbound freight volume for the last year in the Los Angeles market, currently seven percent higher than this time last year.
So how could this impact capacity? When freight hits the East Coast ports, it’s typically consumed close to the port or at the very least, the coast itself. This means more regional runs. When freight hits the West Coast, typically that freight is destined for locations such as Dallas, TX or Chicago, IL, so taking freight up and down the East Coast may be a one-day run. Freight out of the Los Angeles market, heading to further destinations would take a day and a half, two days.
Same freight, same one-truck move, but now it occupies that truck for twice as long. Additionally, this could necessitate a shifting of fleet resources from one coast to the other, potentially creating an over-capacity on one side of the U.S. while the other coast is more desperate for trucks.
SPRING IN 6 WEEKS?
Will that rodent in Pennsylvania be right this year, and will freight volumes accelerate quicker as a result? First of all, ‘ol Punxsutawney Phil is batting less than 50 percent for his career and the last 10 years he’s only been accurate three times.
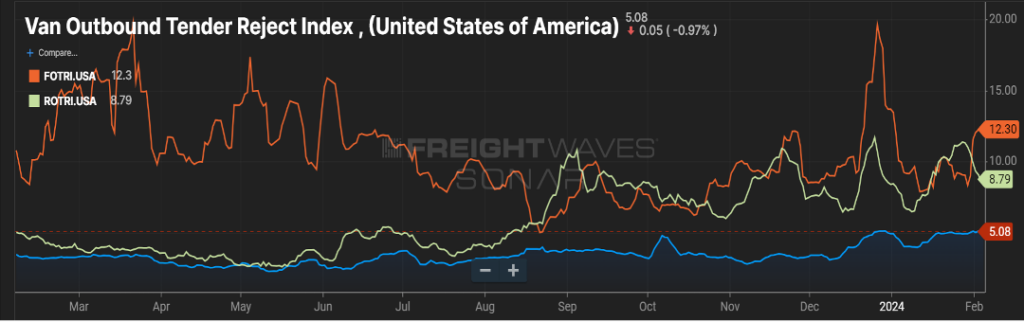
A better canary in the cave would be how the rejection rate index ebbs and flows. As you can see in Figure 3.1, van rejection rates have been pretty stagnant for the past year. Flatbed has remained relatively high and reefer rejection rates have trended up the last five months. If Phil is a soothsayer this year, we expect flatbed rejection rates to continue rising. If produce season also starts earlier than most, reefer rejection rates will then follow.
As reminder, with increases in rejection rates, shippers typically see transportation costs increase on the spot market.
Stay tuned for next month’s update to see if an early spring is a turning of the tide for the freight market.
Stay Up To dAte
Looking for a more frequent update? Subscribe to our newsletter and receive the top five logistics articles of the week every Friday morning by selecting “Weekly News Update” when you select your preferences.
Get Weekly News Updates in Your InboxStay up to date on the latest information on conditions impacting the freight market, curated by Trinity Logistics through our Freightwaves Sonar subscription.
LIKE TRACKING A HURRICANE
I’m sure we’ve all felt like we were in a bad storm over the past few years when it comes to the freight market, and particularly, shipping rates. As we’re now into a new year, shippers and brokers are looking at their 12-month rate forecasts and wondering how things will look come December ‘24. It’s relatively easy to project for the first few months, even the first quarter, but as you get further and further away from when you send those projections to your finance team, the level of angst goes up.
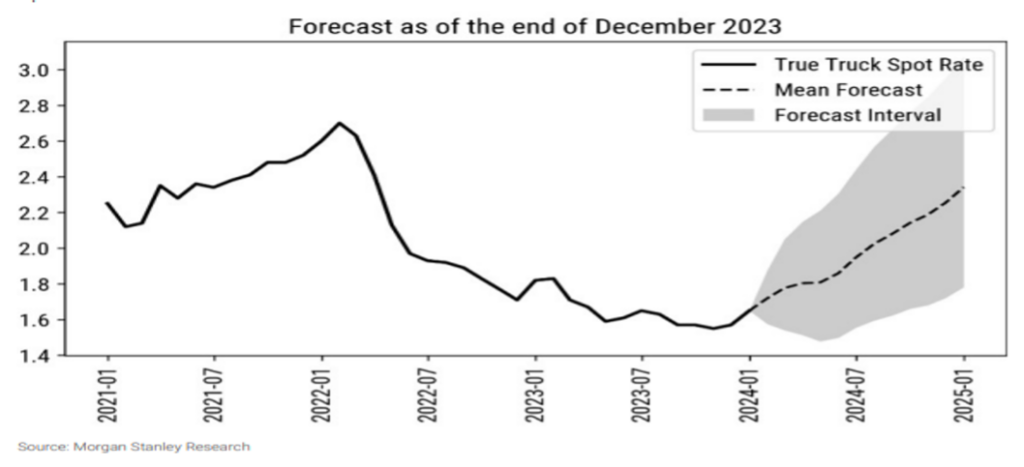
Figure 1.1 will hopefully help in assessing if your year will have a good outcome, or if there may be reason to look at your contingency plan. As we typically see in the first months of a calendar year (setting aside what we saw in 2021), rates are usually at their lowest point due to volume being restrained. Using the current rates for dry van freight, you can see the projections are for upward movement in rates as we go through the year, with rates pushing past $2.30 per mile as we close out 2024. However, as with any forecast or projection, there is always that “margin of error”.
If the projected supply and demand balance is more volatile, it’s possible to see freight rates pushing $0.50-$0.60 per mile higher. On the opposite end, if demand for freight is muted, and the carrier churn rate levels out or, dare I say, we see an increase in capacity, freight rates could be well below $2.00 per mile.
As with any major storm, it’s better to prepare and not need, than the other way around. As a shipper, boosting your carrier and broker base to give you options is always a prudent move.
CONSUMER SPENDING TO STEADY
There are some positive signs for 2024.
The dreaded word “recession” that has been thrown around for seemingly all of 2023 doesn’t seem likely. The U.S. is poised for modest GDP growth and inflation shows signs of easing throughout 2024. There is also a strong likelihood we will see rate CUTS from the Fed this year.
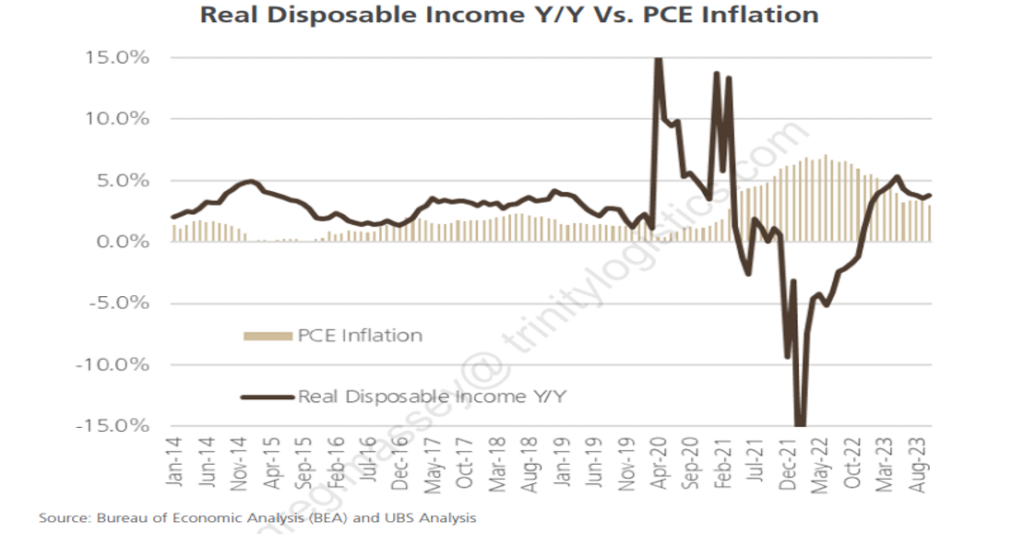
As we know, consumers are a big driver of freight activity. Look no further than the second half of 2020 and all of 2021 to see the impact consumers with disposable income can have on movement of goods. Figure 2.1 gives an indication that consumer buying will continue this year. As the ship steadies with inflation, that line will most likely head towards three percent at the end of the year, as consumers are finding dollars available to spend.
There was a lot of pent-up demand for services that gobbled up U.S. consumer dollars over the past year plus, which lends credence to consumers looking to spend their dollars on things versus services. This will certainly be a shot in the arm for the freight-challenged industry we have experienced over the last 12 months.
Stay Up To dAte
Looking for a more frequent update? Subscribe to our newsletter and receive the top five logistics articles of the week every Friday morning by selecting “Weekly News Update” when you select your preferences.
Get Weekly News Updates in Your InboxStay up to date on the latest information on conditions impacting the freight market, curated by Trinity Logistics through our Freightwaves Sonar subscription.
Shippers – Don’t wait ‘Til It’s Too Late
Probably every shipper has, at certain times or maybe all the time, been inundated with requests to handle their freight over the past year. This is in stark contrast to 2021 and most of 2022 when carriers and brokers were keenly focused on existing customers and not as aggressive in pursuing new business relationships.
Currently, shippers are enjoying relatively abundant capacity and spot rates, which have fallen below $2.00 per mile. As we all know, the freight market is cyclical. Several signs point to a period of supply and demand balance, and likely a crunch with capacity. Will it happen tomorrow? No. Six months from now? Possibly. Most likely, we’ll see this scenario play out as we head toward the latter part of 2024.
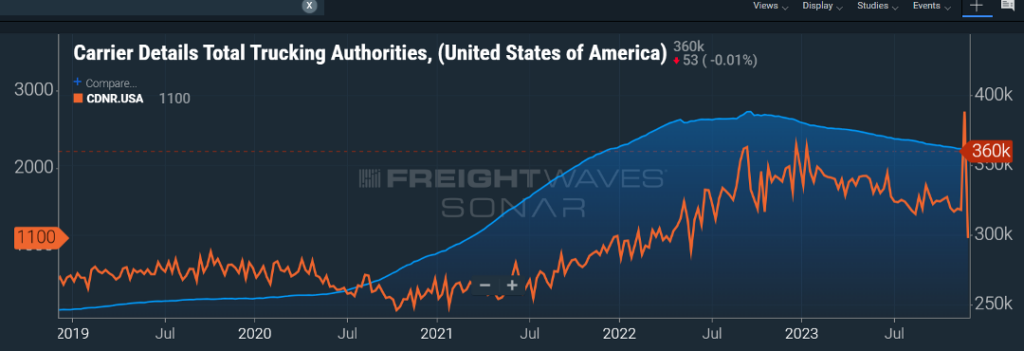
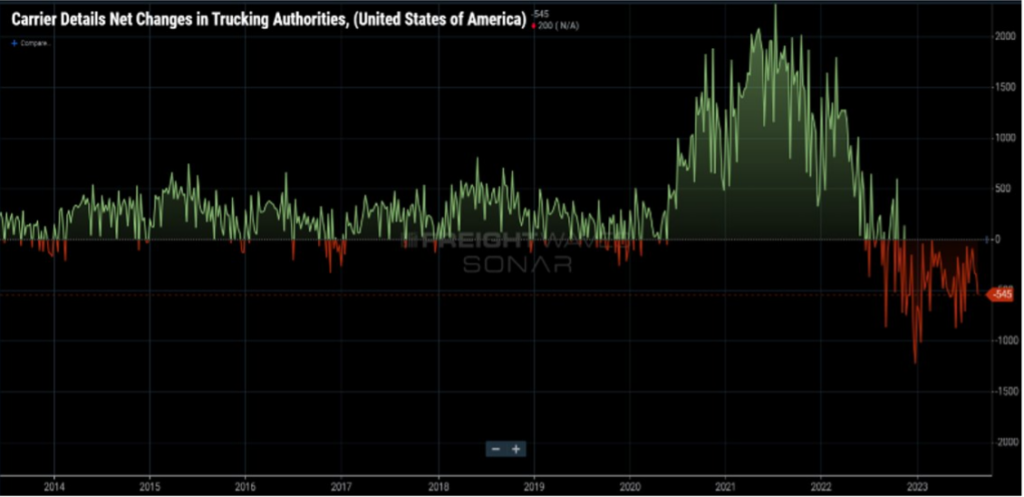
Figure 1.1 shows the total for-hire trucking authorities (blue line) and the carrier net revocations of authority (orange line) over the past five years. Clearly, carriers started flooding the market in late 2020, in response to the surge in goods moving within the supply chain. Much of that was consumer driven thanks to direct and indirect government stimulus action.
As we’ve seen freight volumes decline, carriers, mostly single person operations or small and micro fleets, have decided the juice is not worth the squeeze. This downward trend in available for-hire carriers will continue, and possibly accelerate, as we head toward more lean freight months ahead.
Shippers over the past year have right-sized their provider network. Now is the time for shippers to look at their volume forecasts and imagine having to manage that freight movement with 25-40 percent fewer providers than they currently have in their network.
If you haven’t started efforts to expand your carrier and broker partners, don’t wait until you have freight sitting on your dock and no one to move it from point A to point B. Nobody wants to be stymied like they were just a few years ago.
LTL Costs Rise
Does it feel like LTL shipments are getting more expensive, while truckload shipments are going the other direction? Why are the rates not cheaper if freight volumes are less than what we saw a few years ago?
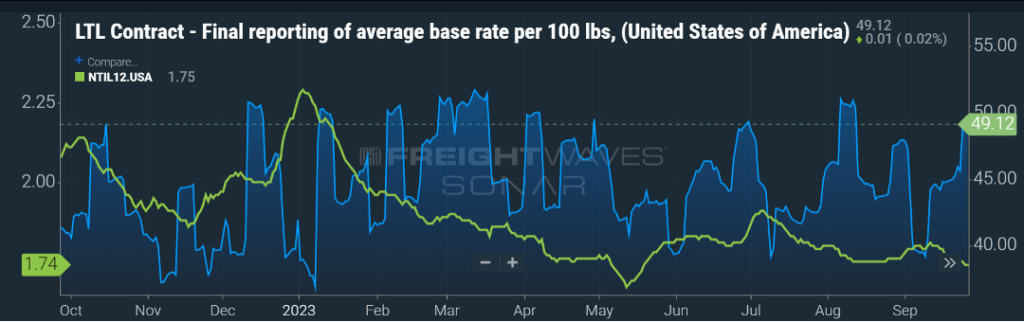
Figure 1.2 shows the spot truckload rate (green line) being almost $0.40 per mile less than the beginning of the year. LTL for the most part has seen rates (blue line) gradually head upwards as we have gone throughout the year.For a new shipper to the industry, this can be a head scratcher.
Short answer, truckload has a much more expansive network of providers, and as we highlighted above, that door being opened for new entrants into the market can happen quickly. The LTL model is more complex and a much bigger barrier of entry to the market. It would be a tremendous capital investment for a new LTL entrant to enter the market – trucks, trailers, terminals, labor, maintenance, etc. With the recent departure of one of the top 10 LTL providers (Yellow Corporation), that freight volume has been gobbled up by the remaining LTL carriers in the market but for the most part at a higher rate.
We are also approaching the time of year when LTL carriers, after assessing their financial statements and forecasting costs for the upcoming year, will start knocking on doors to discuss general rate increases (GRIs). Notice I said “increases”, not the other way. Don’t be surprised when your LTL contact lays out a proposal that elevates your LTL freight spend by four-to-six percent in the coming year.
Stay Up To dAte
Looking for a more frequent update? Subscribe to our newsletter and receive the top five logistics articles of the week every Friday morning by selecting “Weekly News Update” when you select your preferences.
Get Weekly News Updates in Your InboxStay up to date on the latest information on conditions impacting the freight market, curated by Trinity Logistics through our Freightwaves Sonar subscription.
FLAT RATES, EXCEPT FOR LTL
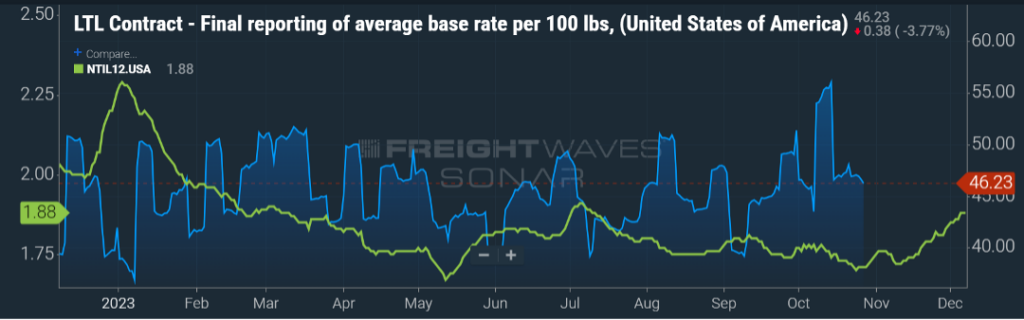
Much of what we have seen this year has been around carrier rates remaining relatively flat. Apart from a few seasonal or holiday peaks, and a slight up or down influence due to fuel costs, spot rates and contract have been stagnant. As you can see in Figure 1.1, the green line has hovered between $1.70 and $1.80 for the past six months.
Less-than-truckload (LTL) rates, one would reason, would follow a similar pattern as they typically follow truckload rate movement with a few months lag. In the past few months, as indicated by the blue line in Figure 1.1, there has been an acceleration in LTL contract rates. As you probably recall, one of the larger LTL carriers, Yellow Corporation, filed for bankruptcy in August and ceased operations.
One may ask, “Well, why would rates elevate when the LTL industry was operating at less than capacity and nothing has caused an influx of new LTL freight?”
Yes, the remaining national and regional carriers were, based on available capacity on the books, able to absorb the freight Yellow was moving with no additional investment in equipment or labor. But just because the available resources are there, does not mean they are positioned in the places where service was needed.
This has necessitated LTL carriers realigning their network to move the freight that Yellow was doing prior. The more prevailing reason for rates to increase is the aggressive nature in which Yellow competed for the freight they were servicing. Typically, Yellow’s rates were far more discounted than most.
So, while the remaining LTL carriers in the network were able to position their fleets to handle the volume, they did not offer the same discounted rates that Yellow did. When you bundle all these factors together, you get rates increasing by about 10 percent in the last several months and I would not anticipate that 10 percent increase being reversed anytime soon. If anything, look for those annual general rate increases to happen as we embark on a new calendar year.
SUPPLY & DEMAND BALANCE IN 2025?
In prior monthly updates, we have highlighted the current freight environment being one of more supply than demand. Suffice to say that truckload freight volumes have been relatively unchanged over the last 12 months and carriers are saying “yes” to almost every shipment offered to them on the contract side.
This has resulted in less freight hitting the spot market and has helped to keep rates at levels that are $0.70-$0.80 less than contract rates. When will there be better balance? A great illustration of this from FTR in Figure 1.2 tells the story.
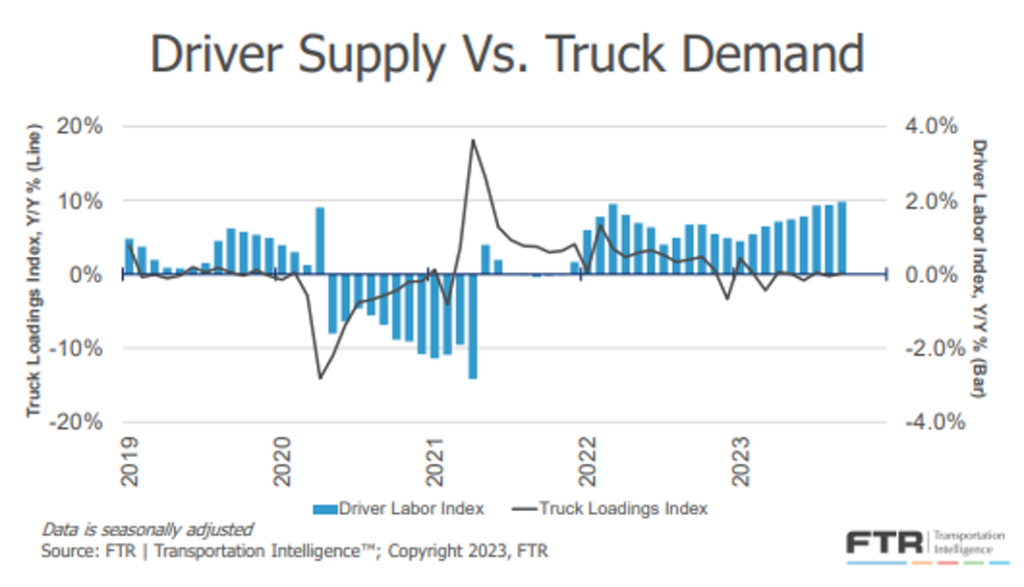
As you can see, the driver labor index sits well above the truck loadings index and has been for the past two years. When you factor in prospects for freight volumes to accelerate, economic conditions, and the pace at which carriers are exiting the market, it will most likely be 2025 before balance returns.
Stay Up To dAte
Looking for a more frequent update? Subscribe to our newsletter and receive the top five logistics articles of the week every Friday morning by selecting “Weekly News Update” when you select your preferences.
Get Weekly News Updates in Your InboxStay up to date on the latest information on conditions impacting the freight market, curated by Trinity Logistics through our Freightwaves Sonar subscription.
Imports on the Rebound?
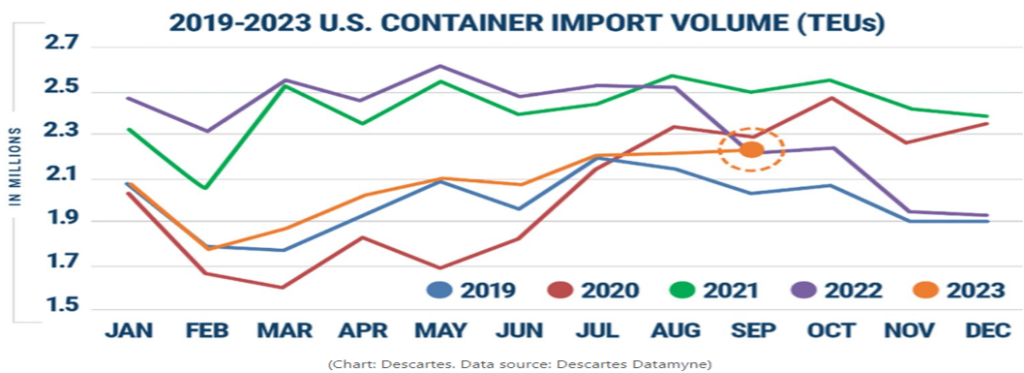
For the past 14 months, much of the conversation around U.S. container import volume has been gloomy.
Figure 1.1 shows the steady decline in import volume that began in August of 2022, and those volumes have remained lower when you compare them year-over-year (YoY) for most of 2023.
September and October have begun to see that narrative change, with September of this year outpacing September of 2022. Comparing this year’s volume to 2021 and even 2022 is somewhat an “apples to oranges” comparison because of the frenzied consumer activity. A better comparison is how 2023 is stacking up versus pre-Covid years.
September 2019 saw approximately 2.05 million twenty-foot equivalent units (TEU’s) come through U.S. ports. September 2023 is seeing an increase of roughly seven percent in comparison. There are numerous efforts underway with U.S. retailers – like Walmart, Target and Amazon – to boost consumer sales with deals ahead of the traditional holiday buying season. This should continue to boost imports through the remainder of the year.
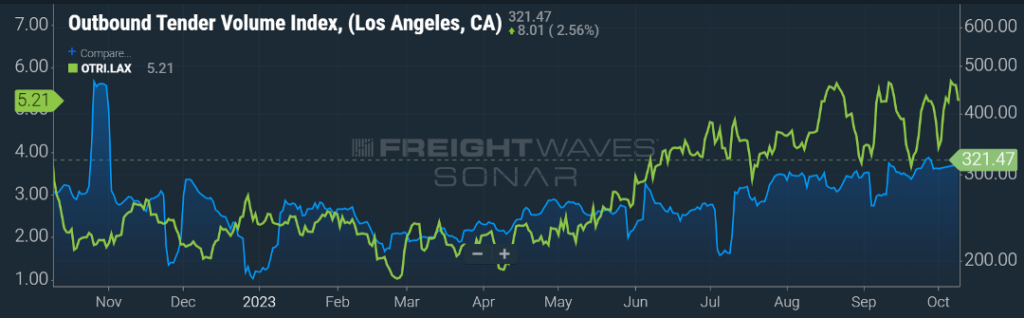
It will be important for shippers, carriers, and brokers to keep an eye on activity around U.S. ports as rates will reflect the supply and demand. An example can be seen the Los Angeles market. As seen in Figure 1.2, in the past 90 days, outbound volume from this market has increased almost 23 percent and the rate of carrier rejections has also shown an upward trend by over 50 percent.
Capacity Declining
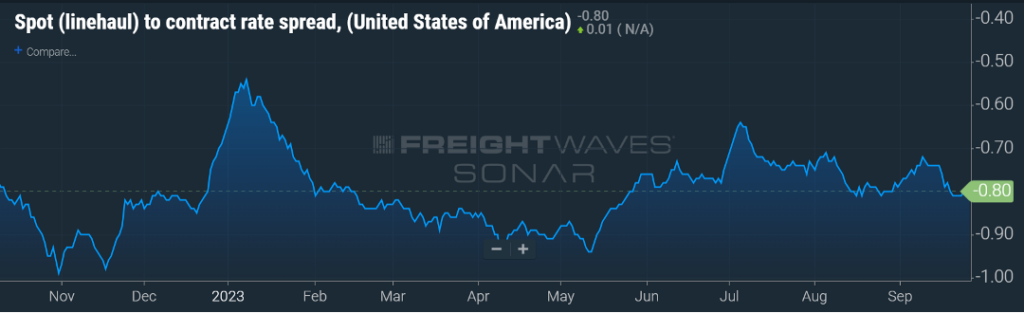
Six months ago, I would have taken a bet with anyone that the spread between contract and spot rates would not be greater than $0.50 per mile.
With capacity exiting the market and shippers making more frequent use of rate tools like mini-bids, the prevailing thought was that spot rates would remain relatively stagnant, or possibly a slight uptick, but contract rates would show a sharp decline. Good thing I was nowhere near a betting window.
The spread continues to hover around $0.80 per mile as seen in Figure 1.3, with contract rates being higher. Annual bid season is fast approaching, and it will be interesting to see if recent upward volume trends combined with an increase in carrier revocations will continue to keep contract rates where they currently reside or if the “sharpen the pencil” adage will be more prevalent.
Stay Up To dAte
Looking for a more frequent update? Subscribe to our newsletter and receive the top five logistics articles of the week every Friday morning by selecting “Weekly News Update” when you select your preferences.
Get Weekly News Updates in Your InboxStay up to date on the latest information on conditions impacting the freight market, curated by Trinity Logistics through our Freightwaves Sonar subscription.
Freight Volumes Stagnant
As the U.S. continues to pull the levers to throttle the over-heated economy we experienced over the past few years, freight volumes, which are largely driven by consumer activity, have seen the impact of less buying from John and Jane Doe. It’s expected that muted consumer activity will continue through the first half of the calendar year 2024. We still expect to see a seasonal increase in spending at the end of the year for holiday shopping, but with consumers being more dependent on credit for purchases, and the rate of savings on the decline, expenditures are expected to be less than in prior years.
Combined with declines seen on the industrial production and manufacturing side, the hope for a rebound in freight volumes will not take place in 2023. The prevailing thought at this point is a return to a more balanced supply and demand regarding freight transportation will be driven by carrier attrition.
Nobody likes to see businesses fail, but we continue to see a market where oversupply has created trucking rates, particularly on the spot side, that are borderline if not less than what it costs a carrier to operate. Since the middle of 2022 and continuing this year, that decline in carriers for hire has continued as seen in Figure 1.1. Most of the attrition is carriers with five trucks or less, but as we’ve seen recently with Yellow Corporation closing its doors, no carrier is immune.
Capacity Declining
To further illustrate the impact of freight volumes on capacity, Figure 1.2 shows how capacity responds, almost in lockstep, with increases and decreases in freight volumes.
As freight volumes were accelerating in the latter part of 2020 and through early 2022, trucking companies popped up at a rapid pace to meet the demands of shippers. Carrier compliance, to a small extent, took a backseat as shippers were eager to make new friends with those who could get their product off the docks and to the end user in a race to satisfy consumer demand.
As freight volumes started to decline, as seen by the blue line in Figure 1.2, the need for capacity waned and began the downward trend (as shown by the white line) regarding carriers in the market.
Stay Up To dAte
Looking for a more frequent update? Subscribe to our newsletter and receive the top five logistics articles of the week every Friday morning by selecting “Weekly News Update” when you select your preferences.
Get Weekly News Updates in Your InboxStay up to date on the latest information on conditions impacting the freight market, curated by Trinity Logistics through our Freightwaves Sonar subscription.
Length of Haul Does Impact Acceptance Rate
If you’ve been following the overall U.S. volume and shipment rejection rates this year, aside from the typical blips seen around the holidays, these have been relatively stagnant. The overall rejection rate has hovered very near the three percent range.
However, if you break that down by the length of haul, it’s clear that carriers clamor for those short-haul shipments, anything less than 250 miles, as this typically will allow the drivers to be home at night. On the other end of the spectrum, those mid-range shipments (250-450 miles) are seeing the highest rejection rate, just below four percent as seen in Figure 1.1.
There could be several reasons for this. Most likely it’s the fact that a driver can make a trip of that length in one day, but it’s not a full day’s worth of driving. So, if the driver is getting a per-mile rate and not driving for the full 11 hours that are eligible, this length of haul “loses” money when compared to longer shipments that allow the driver to hammer down for the full allotment of driving hours.
Now, I realize four versus two-point-five percent doesn’t seem like a big gap, but that is a 60 percent variance. If the freight volumes and capacity begin to balance, and rejection rates by length of haul follow the same trends, you could see mid-range rejection rates in the 15 percent range while shorter hauls only see rejection rates in the six percent range. Certainly that will have an influence on future rates.
SPOT AND CONTRACT GETTING CLOSER
As expected in Figure 1.2, the variance between contract and spot rates continues to shrink. Since the widest gap this year, when contract rates were about $0.78 per mile higher than spot rates, the gap has shrunk by almost 30 percent in a three-month period.
For the most part, spot rates have found a floor, and if anything, have seen a modest uptick. Contract rates have seen frequent requests for re-pricing. Carriers continue to refine their contracted rates balanced with the expectation of almost 100 percent compliance with freight tenders and excellent service.
In 2021 and 2022, shippers were open to expanding their carrier and broker pool as capacity constraints and increased volume necessitated more choices. Now that the balance has shifted, shippers are looking to right-size their partners, with a mix of compliance, price, and service steering their decision-making process.
Stay Up To dAte
Looking for a more frequent update? Subscribe to our newsletter and receive Weekly News Updates every Friday by selecting “Weekly News Update” when you select your preferences.
Get Weekly News Updates in Your Inbox