
09/13/2024 by Greg Massey
September 2024 Freight Market Update
Stay up to date on the latest information on conditions impacting the freight market, curated by Trinity Logistics through our Freightwaves Sonar subscription.
YES, IT IS IMPORT-ANT
There has been much buzz in the last month around inbound container volumes to U.S. ports. There are 300+ ports of entry for goods into the country, with much of that volume handled by the top 20. Most of that buzz is around the uptick in volume.
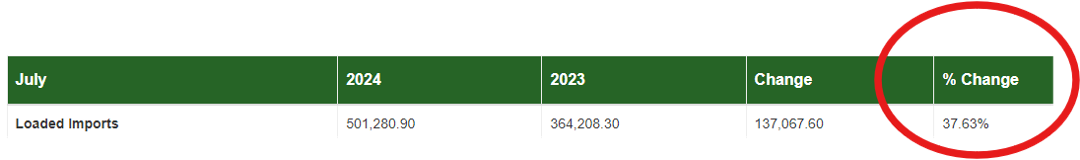
In figure 1.1, you will see for the port of Los Angeles, the largest in the country, that container volume is up almost 38 percent. That’s certainly impressive, but the neighboring port (Long Beach) was up a staggering 60 percent.
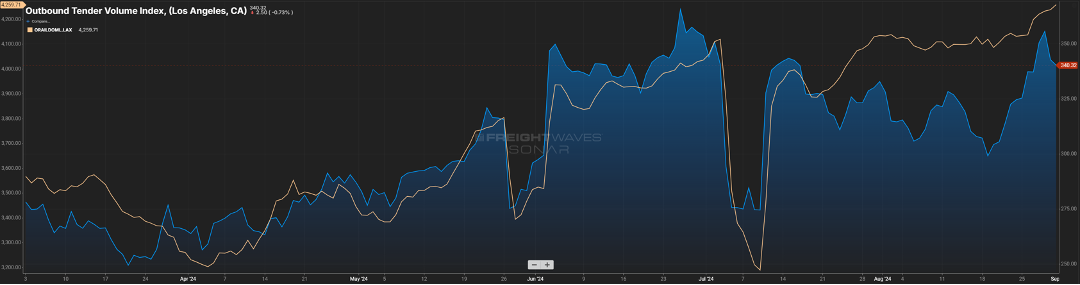
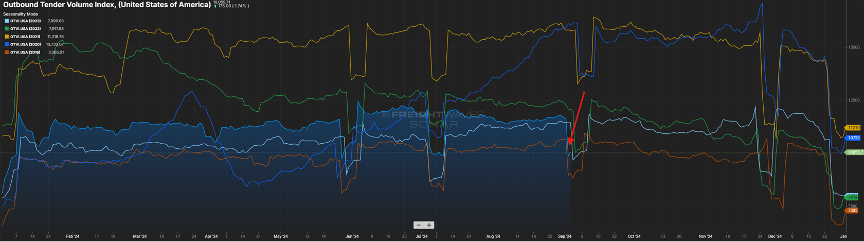
Many would anticipate this similarly impacting the outbound over-the-road volume for that market. And yes, while we see in Figure 1.2 via the blue line, there is a noticeable increase from what it was heading into the Memorial Day holiday, but it is not a direct correlation. The beige line represents the domestic rail volume from that same market, and unlike what we experienced in the “Covid years”, the rails have been a bigger mover of goods versus the bottlenecks we saw back then.
We should expect to see import volumes continue through the next few months. As goods produced overseas have become cheaper to buy, major retailers have taken advantage of these discounts with the anticipation of robust consumer spending. Remember, almost three-fourths of inbound volume is directly related to consumer purchasing. Good news for consumers as these retailers will want to liquidate this inventory quickly at lower prices.
NOT FAR FROM HEALTHY
While not in balance, the spread between contract and spot rates continues to shrink, now sitting about $0.60 per mile higher on the contract side. Keep in mind this gap was in the $0.75 to $0.90 for much of the past year. Almost in lockstep has been the tender rejection index. It has continued its slow upward movement as seen by the green line in Figure 2.1.
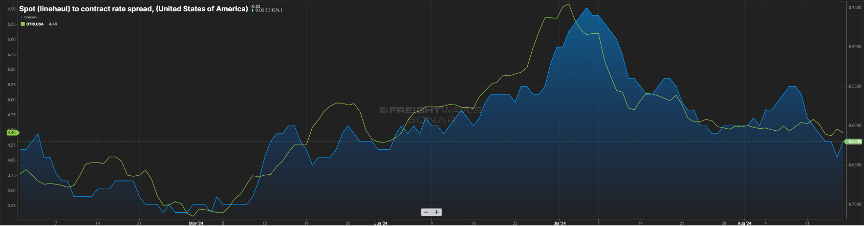
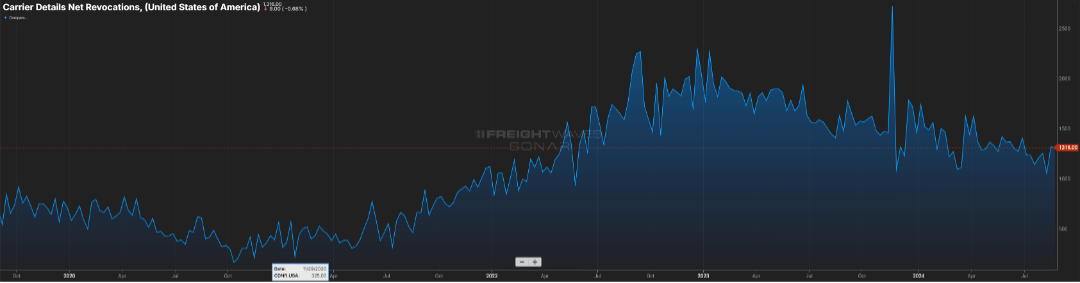
This can be attributed to capacity continuing to shrink slightly (Figure 2.2) and contract rates moving downward. It’s rare that spot rates will eclipse contract rates, but a spread of $0.40 to $0.50 is indicative of a healthier market, and we are not far from that right now.
I spent a few days traversing the state of Tennessee recently. At one stretch of a major interstate, there was a back-up at least five miles long. Luckily for me, it was on the eastbound side, and I was heading the opposite direction.
What struck me was the sheer number of trucks that sat idled. By my estimates, almost 80 percent of the volume was truck traffic. And while you can’t tell if a van is loaded or not, every single flatbed had freight on it. So, ladies and gentlemen, freight is still moving in this country. While it may not feel like it, volumes are trending close to 2022 levels as seen in Figure 3.1 (blue vs. green line). They say the fourth quarter is the time when carriers make hay; so here’s to an optimistic outlook for the next four months.
Stay Up To dAte
Looking for a more frequent update? Subscribe to our newsletter and receive the top five logistics articles of the week every Friday morning by selecting “Weekly News Update” when you select your preferences.
Get Weekly News Updates in Your Inbox