
03/16/2026 by Greg Massey
March 2026 Freight Market Update
Get the latest insights shaping the logistics industry with Trinity’s February 2026 Freight Market Update, powered by our Freightwaves Sonar subscription.
The Rejection Revival
There are definitely things afoot that can flip the market as we currently know it.
For now, let’s talk about the word “no.”
Carriers were not used to saying that word for much of the last 3 years.
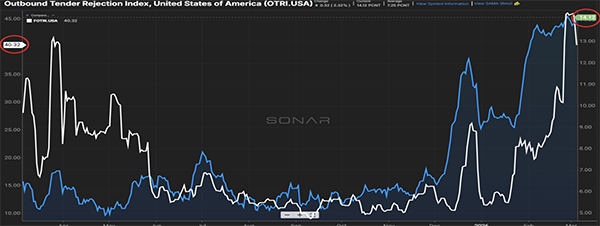
Recently, that has not been the case. Rejection of tenders to carriers started to creep upwards in December 2025.
Maybe it was a seasonal thing. But then it continued into January.
Maybe it was related to the weather. Yet here we are on the cusp of spring, and rejections still remain elevated at 14% (Figure 1.1).
What is even more impressive is that the rejection rates we are seeing on open-deck shipments are currently hovering around 40%.
Wait, did you say flatbeds, at a time when typically, you don’t see much activity for that type of equipment, are seeing a 40% rejection rate?! Yes, we did.
The Midwest Surge
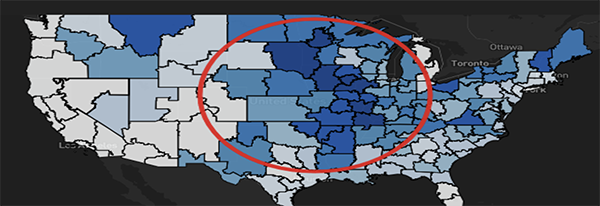
One needs to look no further than the Midwest to get an idea of where the capacity crunch is manifesting itself.
It’s common to see dark shades of blue (Figure 2.1), measuring the severity of rejection rates, on the East and West Coast states. Seeing it this pronounced in the Midwest, in the winter months, is an abnormality.
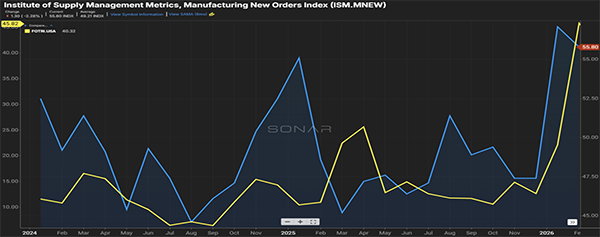
Part of it can be attributed to a demand for refrigerated trailers to keep product from freezing during transit. Another part can be attributed to an increase in the manufacturing side (Figure 2.2).
The manufacturing index has recently broken the 50-score barrier, which typically signals growth, and the fact that the rejection index for flatbeds is mirroring that, is no coincidence. Much has been made of the recent development happening around new data centers. There’s a good bet much of that increased activity is directly related to the construction of them.
The Capacity Reset Continues…
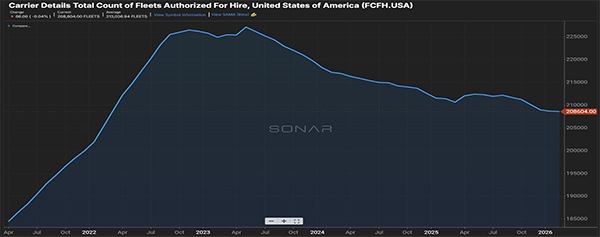
Finally, the exit of carriers in the freight market continues (Figure 3.1).
Carriers that were already under pressure from increased costs and stagnant rates (although recent spot rates have provided some relief), along with mandates and regulation enforcement, not to mention the ability to simply enter the trucking market being more stringent, has allowed the capacity side to find an equilibrium after the surge experienced years earlier that cannibalized rates.
Stay Ahead of the Market
Enjoyed the February 2026 freight market update? Subscribe to our email list to receive next month’s delivered straight to your inbox in our monthly newsletter. Looking for more frequent insights? Choose our Weekly News Update for logistics news in your inbox every Friday morning.
Don't Miss the Next One – Sign Up Quote Your Next Shipment With Trinity