

10/16/2026 by Amanda Lloyd
October 2026 Freight Market Update: Why Aren’t Trucking Rates Falling with Freight Volumes?
Freight volumes are falling. So why aren’t trucking rates following?
National truckload tender volumes have declined approximately 6% from our mid-September snapshot. Yet van contract rates remain near annual highs, spot pricing is above its one-year average, and carriers continue rejecting more than 13% of contracted freight tenders.
The September Logistics Managers’ Index adds another dimension, reporting contracting transportation capacity and widespread transportation price increases.
These indicators reveal an important distinction: Lower freight activity doesn’t automatically translate into lower transportation costs or easier carrier acceptance.
As we move further into Q4, understanding that difference matters more than focusing on any single market indicator.
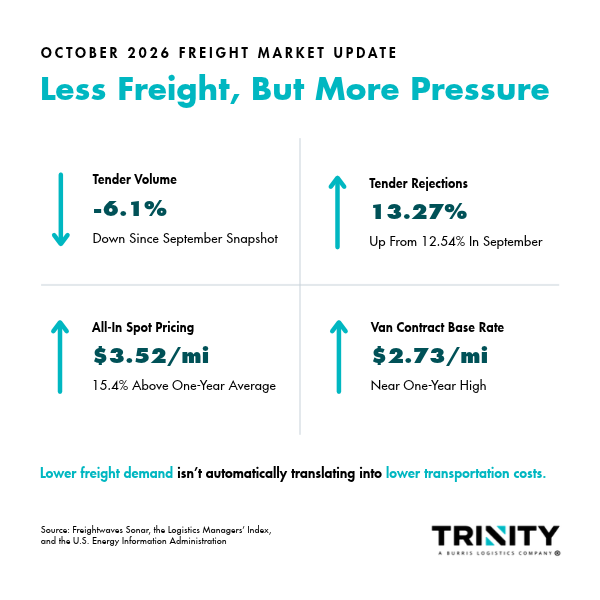
October Freight Market Snapshot
Here are the key numbers shaping the freight market this month:
| Market Indicator | Latest Reading | What It Tells Us |
|---|---|---|
| National Tender Volume (OTVI) | 9,572 | Down 6.1% from September’s snapshot |
| National Tender Rejections (OTRI) | 13.27% | Up from 12.54% in September |
| All-In Truckload Spot Rate (NTI) | $3.52/mile | 15.4% above its one-year average |
| Linehaul-Only Spot Rate (NTIL) | $2.50/mile | 8.7% above its one-year average |
| Van Contract Base Rate | $2.73/mile | Near its one-year high |
| National Diesel | $6.179/gallon | $2.514 higher than a year ago |
| September Logistics Managers’ Index | 70.2 | Faster growth in overall logistics activity |
Sources: FreightWaves SONAR, U.S. Energy Information Administration (EIA), and September 2026 Logistics Managers’ Index. SONAR readings reflect mid-October snapshots. The LMI reflects September survey conditions.
Freight Volumes Are Falling. Carrier Rejections Aren’t.
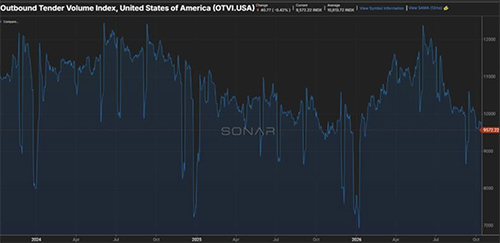
National freight tender volumes have been moving lower since early summer.
The Outbound Tender Volume Index (OTVI) currently sits at approximately 9,572, down 6.1% from our mid-September reading of 10,191 and roughly 7% below its one-year average. The decline follows a period of stronger activity earlier in 2026, when tender volumes climbed above 12,000 in June before gradually retreating.
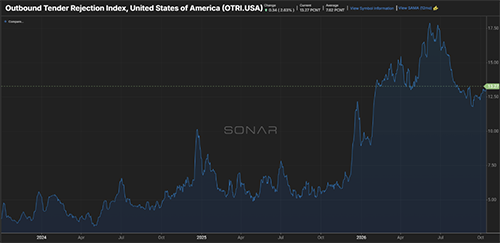
Carrier rejection rates, however, have moved slightly higher.
The Outbound Tender Rejection Index (OTRI) currently sits at 13.27%, compared with 12.54% in September. Although rejection rates remain below their summer peak near 18%, they are still elevated compared with much of 2024 and 2025. In other words, lower tender volumes have not been accompanied by a comparable improvement in carrier acceptance.
This doesn’t necessarily signal a new tightening cycle. Tender volumes and rejection rates measure different aspects of freight activity, and neither indicator explains the underlying cause on its own.
October’s data demonstrates why freight volumes alone cannot tell shippers how easily they’ll secure carrier capacity.
What This Means For Shippers
Monitor primary carrier acceptance and tender rejections on your most important lanes. National freight volumes provide useful context, but your actual capacity experience may look different.
3 Year Trend
Source: FreightWaves SONAR
3 Year Trend
Source: FreightWaves SONAR
Trucking Rates Remain Elevated Despite Softer Demand
If freight volumes are declining, shouldn’t transportation rates be declining too? October’s pricing data shows why that assumption deserves a closer look.
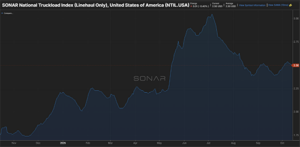
The SONAR National Truckload Index (NTI), which includes fuel, currently sits at approximately $3.52 per mile. That’s more than 15% above its one-year average of $3.05. Spot pricing has eased from its early-July peak near $3.80 per mile, but it has recovered from its late-summer lows.
Fuel isn’t the only factor reflected in elevated spot pricing.
The National Truckload Index Linehaul (NTIL), which excludes fuel, currently sits at $2.50 per mile, compared with its one-year average of $2.30. Meanwhile, reported van contract base rates have continued trending higher, reaching approximately $2.73 per mile, up from $2.68 in our September snapshot.
These indicators measure different components of transportation pricing, so their values shouldn’t be treated as directly interchangeable. Still, each remains above its respective one-year average.
Despite declining tender volumes, both spot and van contract rate benchmarks remain above their one-year averages. Contract pricing can also respond differently from spot pricing, making it important to evaluate both markets rather than relying on a single benchmark.
What This Means For Shippers
Review spot and contract pricing together, particularly on lanes approaching a bid or contract renewal. A decline in national freight activity does not automatically mean current transportation rates will be lower.
1 Year Trend
Source: FreightWaves SONAR
Flatbed Freight Is Telling a Different Story
Flatbed freight provides an important contrast to the broader truckload market.
Flatbed tender volumes have declined substantially from their spring highs. The Flatbed Outbound Tender Volume Index currently sits near 26,217, approximately 18% below its one-year average.
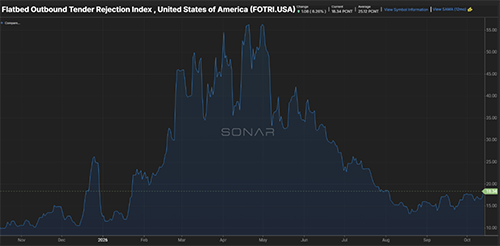
National flatbed carrier acceptance has also improved considerably since spring, with rejection rates falling from approximately 57% to 18.34%. Although the latest reading is slightly above September’s 17.27%, it remains well below the tighter conditions experienced earlier this year.
Unlike the broader national truckload indicators, flatbed tender volumes and rejection rates have generally moved lower together since spring. However, national improvements don’t guarantee the same conditions across every market. Equipment requirements, shipment characteristics, and regional differences continue to influence carrier availability.
What This Means For Shippers
If flatbed transportation was particularly challenging during the spring, current conditions may warrant another review of carrier availability and pricing on those lanes.
1 Year Trend
Source: FreightWaves SONAR
Diesel Prices Ease, but Fuel Costs Remain a Challenge
Diesel prices have eased since late September but remain substantially higher year over year.
According to the U.S. Energy Information Administration, the national average on-highway diesel price reached $6.179 per gallon for the week of October 12. That’s down from $6.382 on September 28, a decline of approximately 20 cents per gallon over two weeks.
However, diesel remains $2.514 per gallon higher than a year ago.
Regional differences are also substantial. The Gulf Coast averaged $5.809 per gallon, while the West Coast reached $7.240. California remained considerably higher at $8.091 per gallon.
For shippers operating across multiple regions, these fuel differences can materially affect transportation costs. They also reinforce why fuel-inclusive spot pricing and linehaul-only rates should be evaluated separately.
What This Means For Shippers
Monitor fuel surcharge exposure alongside base transportation rates. Even when diesel prices decline nationally, regional fuel costs can create different pricing conditions across your network.
Broader Logistics Activity Accelerated in September
While national truckload tender volumes have declined, the September Logistics Managers’ Index indicated faster growth in overall logistics activity.
The LMI increased to 70.2, up from 66.6 in August. The report also highlighted several developments:
- Transportation Capacity fell to 34.4, indicating continued contraction.
- Transportation Prices climbed to 92.7, signaling widespread price increases.
- Inventory Levels increased to 58.9, indicating expanding inventory activity.
These diffusion indices measure how widely conditions are expanding or contracting among survey respondents, rather than the percentage change in actual prices, shipments, or capacity. The findings provide useful context for October’s truckload data.
While SONAR measures electronic freight tender activity, the LMI captures broader changes across transportation, warehousing, and inventories. The two sources also cover different reporting periods. Together, they suggest that softer national tender volumes are occurring alongside broader logistics cost and capacity pressures.
Inventory growth is another development worth watching. Whether those inventories translate into additional freight movement during Q4 remains to be seen.
What This Means For Shippers
Keep an eye on inventory movement, carrier acceptance, and transportation pricing together. Changes in one indicator don’t necessarily produce an immediate or equal response in the others.
What We’re Watching Next
As the fourth quarter progresses, three developments will help clarify the market’s direction.
Will carrier rejection rates continue rising? National OTRI has edged higher despite softer tender volumes. Whether that movement continues will be important for understanding carrier acceptance.
Will spot rates hold above their annual averages? Linehaul-only spot pricing has recently traded near $2.50 per mile after retreating from its summer peak. The next several weeks will help determine whether that level holds.
Will inventory growth translate into additional freight activity? September’s LMI showed expanding inventory levels. We’ll be watching whether that activity is reflected in national truckload tender volumes as Q4 continues.
The Bottom Line
Lower freight volumes don’t always mean lower transportation costs.
October’s data makes that clear. National tender activity has softened, but carrier rejection rates and pricing remain elevated. Flatbed conditions have improved considerably from spring, demonstrating why national averages don’t tell the entire story.
For shippers, the priority isn’t predicting every market movement. It’s understanding which changes affect their transportation network and where adjustments may be warranted.
The freight market doesn’t always move in one direction. Your transportation strategy shouldn’t depend on a single indicator.
Your Q4 Freight Planning Checklist
- Review primary carrier tender acceptance on your most important lanes.
- Compare current spot and contract rates ahead of upcoming bid renewals.
- Reevaluate flatbed capacity and pricing on lanes that were tight this spring.
- Review fuel surcharges separately from base transportation rates.
- Watch inventory movement and its potential impact on Q4 freight demand.
Don’t Let Market Shifts catch you off guard
Freight conditions can shift quickly and have a major impact on your transportation strategy. Subscribe to receive our monthly Freight Market Update in your inbox and also have the option to receive our Weekly News update for a quick Friday morning snapshot of what’s shaping the market.
Don't Miss the Next One – Sign UpLooking for a more reliable transportation strategy? Request a free quote for your next shipment and see how Trinity helps shippers stay flexible in changing market conditions.
Quote Your Next Shipment With TrinityMarket data sourced from FreightWaves SONAR, the Logistics Managers’ Index, and the U.S. Energy Information Administration. Market conditions and index values reflect the latest available data at the time of publication and are subject to change.