B2B credit management has evolved since 2019. Here’s how to ensure your credit department succeeds.
The COVID-19 pandemic drastically changed the world, businesses, and their credit departments. It reshaped our economy. In order to meet the changing business landscape, credit managers have adapted quickly to maintain their companies’ financial stability.
Let’s briefly review the economy before the pandemic started. This will give us a clearer picture of the changes that have happened and the difficulties B2B credit managers now face. We’ll look at how your sales team can become a credit ally and close with tips on how to decision today’s B2B credit with success.
Pre-Pandemic Stability
Before COVID-19, the economy experienced comparatively stable growth. Companies were generally optimistic about their clients’ creditworthiness. The approval process for B2B credit managers was a relatively simple routine. They usually assessed customer creditworthiness based on financial statements, credit reporting, and industry benchmarks. Once a credit limit was approved, customers were generally given net payment terms.
Pandemic-Induced Shifts
The pandemic triggered a series of economic shifts that profoundly affected B2B credit practices. Government stimulus programs, supply chain disruptions, and inflation surges all contributed to a climate of uncertainty and volatility.
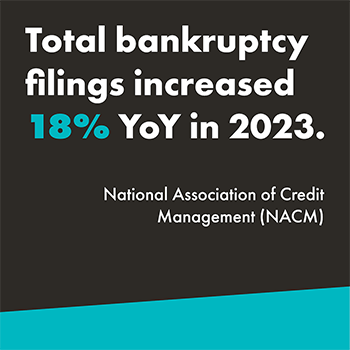
According to the National Association of Credit Management (NACM), total bankruptcy filings increased 18 percent year-over-year (YoY) in 2023.
As a result of these changes, businesses became more cautious about extending credit and credit managers had to adopt a more rigorous approach to risk assessment.
6 Key Changes in B2B Credit Management

In-Depth Credit Risk Assessments
Economic changes caused credit managers to become more reliant on data analysis to assess creditworthiness. This includes using financial modeling tools to assess a company’s ability to meet its debt obligations. Credit bureaus and alternative data sources are also leveraged to achieve a comprehensive view a customer’s financial health.
Tighter Credit Terms
As businesses become more risk-averse, they are tightening their credit terms. This can involve shortening payment terms (e.g., from net 60 to net 30), reducing credit limits for existing customers, and issuing lower initial credit lines for new customers. According to a March 2024 report by HighRadius, 52 percent of companies seek extended terms – quite the opposite view. The same report shows that 17 percent of customers blatantly ignore credit terms while another 48 percent intentionally delay payment. This can make building strong customer relationships difficult.

Increased Use of Credit insurance
The rise in economic uncertainty has led to a surge in demand for credit insurance. Credit insurance protects businesses from monetary loss if a customer defaults on their payments. A 2023 survey by AU Group shows that since the third quarter of 2022, the number of business failures in almost every region of the world has risen. In line with that statistic, credit insurers expect growth in their sales over the next six years.
Growing Use of Digital Credit Tools
The pandemic has accelerated the adoption of digital credit tools and automation. Tasks like processing credit applications, credit checks, and collections are now being completed faster and allowing credit teams to focus on exception management.
Collection Challenges
The pandemic caused many businesses to experience cash flow disruptions. It’s made it more difficult for some companies to meet and/or maintain on time payments.
Cash Flow Management
Businesses are focusing on more effective ways to manage their working capital. This can include reworking their collection processes and closely tracking inventory levels.
Opportunity Emerges
All these changes have significantly affected credit managers and their teams. Now, they carry heavier workloads and face increased pressure to mitigate credit related risks. They also need to be able to adapt to rapid changes that may happen in today’s economy.
While these changes may have increased the burden on credit managers, they’ve also created opportunities for collaboration with sales teams. By working together, credit managers and sales teams can better service their businesses and customers.
5 Ways B2B Credit Managers Can Seek Help from Sales
In today’s risky and fraud-ridden environment, the sales team support in customer onboarding and credit is vital. Credit and sales teams must collaborate to ensure a positive and seamless customer experience. Here are some tips to foster better collaboration:

Educate for an Improved Understanding
Sales teams are crucial in helping gather customer information to assess creditworthiness. Credit managers can help sales teams understand the importance of collecting this information. Sharing its use and how having it can make the approval process faster helps, too.
Develop a Standardized Form
A standardized customer information form ensures sales teams collect all the required information. This can help streamline the credit approval process.
Encourage Proactive Customer Updates
Credit teams must stay updated on customer developments. Encourage the sales team to proactively share any relevant customer updates with the credit department. Discuss what information is “relevant”, so everyone is on the same page.
Have a Joint Review Process
Joint sales and credit reviews can ensure both teams understand customer creditworthiness. They can help prevent incidents where a customer is given an okay by sales and later is deemed to be a credit risk. At the same time, joint reviews will strengthen the relationship between sales and credit while improving the customer experience.
Foster Open Communication and Trust
Open communication and trust are essential for effective collaboration between teams. Credit managers should be available to answer sales teams’ questions and provide guidance on any credit-related matters.
Is This the New Normal for B2B Credit Management?
It appears this “new normal” of post-pandemic business is here to stay, and it’s changed credit management for the foreseeable future. Because of this, we must have a more strategic and data-driven approach to B2B credit management. Those credit teams that adapt to these changes and improve collaboration with sales will be well-positioned to thrive in today’s economy. Furthermore, those who stay flexible and committed to delivering exceptional service will aid their company’s success. Will your credit team be the ones to hold revenue back or help drive it forward?
Get More Content Like This In Your InboxAbout the Author

Tracy Mitchell currently holds the position of Director of Accounts Receivable at Trinity Logistics. She has worked at Trinity for nine years, with over five years of those in credit management. She holds a Credit Business Association (CBA) designation. With a deep understanding of the industry’s dynamics, she has firsthand knowledge and provides the company with invaluable insights into the complexities of credit risk assessment, collections, and sales alignment.
Stay up to date on the latest information on conditions impacting the freight market, curated by Trinity Logistics through our Freightwaves Sonar subscription.
What to Expect in the Short-Term
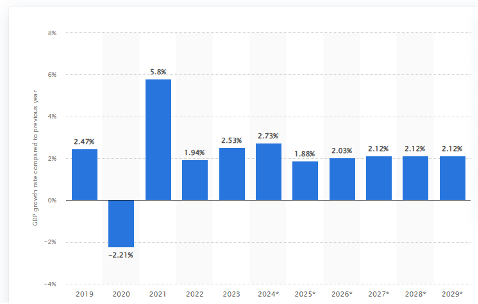
Well, so much for a recession. The U.S. is anticipating year-over-year growth of 2.8 percent in 2024 with regards to gross domestic product (GDP). That percentage of growth appears to be trending less in calendar 2025, with moderate growth forecast through the end of 2029 (Figure 1.1).
Generally, for every one percent of GDP growth, that typically translates into 1.5 percent growth in over-the-road truckload volume. Based on those projections, we expect freight volumes to climb by four to five percent in the coming year.
Conditions are also turning more favorable for a pendulum swing to the side of the carriers. Two reasons for the bullish outlook – dwindling capacity and tariffs (be it threat or real), simple supply and demand.
INCHING CLOSER TO BALANCE
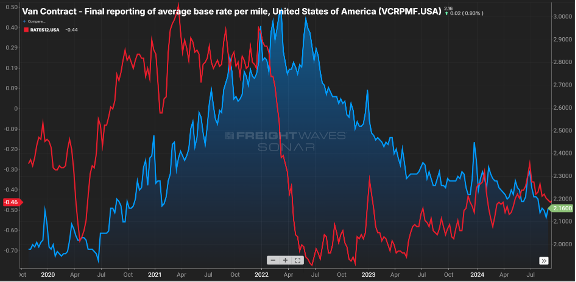
On the capacity side, the spread between contract and spot rates, which was near $0.80 per mile in the middle of 2022, has now fallen below $0.50 per mile. Keep in mind contract is almost always above spot sans latter 2020 and early 2021.
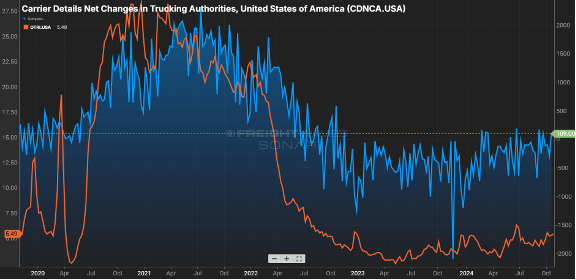
The gap has closed primarily due to contract rates receding, from the $2.30 range in early ’24 to now being $0.15 less, as illustrated by. Figure 2.. Figure 2.2 shows the net change in for-hire carriers versus the tender rejection rate. Since mid-2022, carriers have started to shun the market as higher costs to operate & lower rates made sustainability a challenge.
Where does shrinking capacity first show up? In the tender rejection rates. Carriers will say no to a guaranteed rate load either because they have no equipment in the area or there is a more favorable paying load available.
Rejection rates cresting the five percent mark may not sound significant, but keep in mind rejection rates were in the two to three percent range as we started this calendar year. Eight to 10 percent is a more balanced market, and we are close to that. Usually, rejection rates in double digits signify more pricing leverage is held by the carrier community.
The other driving factor is around demand. While there are some sectors showing slight gains, the November election could be the spark that drives a glut of freight movement.
With Republicans poised to control the White House and Congress, impending tariffs will drive a flurry of activity as shippers look to move goods prior to an imposed increase in cost, This is likely a short-term surge as “too much inventory” is a real thing, and once tariffs are imposed, consumers ultimately will feel the brunt of increased costs and could hamper purchasing. However, the next pivot point will be around movement of production to domestic U.S. or near-shore locations.
After a blah few years, things are about to get interesting.
Stay Up To dAte
Looking for a more frequent update? Subscribe to our newsletter and receive the top five logistics articles of the week every Friday morning by selecting “Weekly News Update” when you select your preferences.
Get Weekly News Updates in Your InboxStay up to date on the latest information on conditions impacting the freight market, curated by Trinity Logistics through our Freightwaves Sonar subscription.
Feels like 2022
For the majority of this year, volumes have seen their traditional seasonal patterns and have been trending above 2023 levels. Many have commented that market balance will be driven more by carrier attrition versus an event that spurs freight volumes.
2022 was a pretty good year from an industry standpoint. Volumes were still elevated (certainly not like we saw in 2021) and capacity was inline. While it may be a blip on the radar, we have now seen the Outbound Tender Volume Index eclipse 2022 levels for the first time in two years as seen in Figure 1.1.
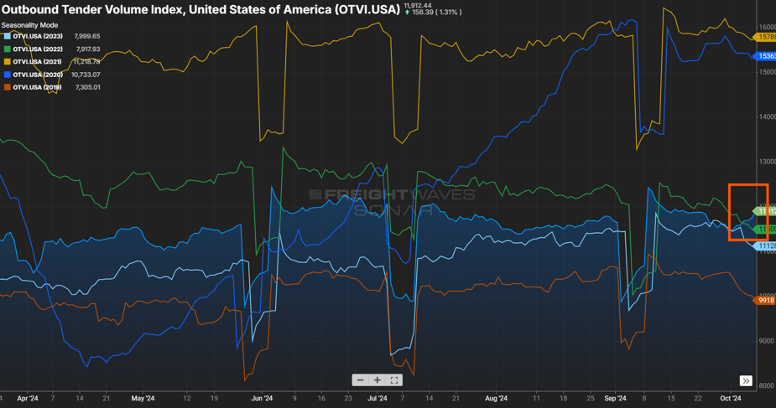
I think it is still too early to pin the volume uptick on the interest rate reduction or the recent hurricanes that severely impacted states in the southeast, but these events, and any potential storms that might still pop up (hurricane season isn’t quite over yet), could impact freight volumes in the coming months. Combined with consumers continuing to spend, volumes could remain consistent through the end of the year versus following their traditional end of year downward movement.
FINE….FOR NOW
While there was a sigh of relief from many with the ILA and USMX reaching a deal on wage increases for dock workers, this does not mean that everything is resolved, and potential port disruptions could occur at the 20-something docks along the East and Gulf coast.
Union-member wages were the major bargaining chip that was agreed upon last week, with dock workers receiving an immediate pay increase, with yearly pay increases to follow. When all increases have taken effect, dock workers will see a 62 percent increase in pay. One issue that was not finalized was the use of automation at select ports, which the labor union has opposition to full and semi-automation. The two sides will continue their negotiation discussions, with a timetable of three months from now to finalize a deal.
If these points can’t be resolved, it may be rinse and repeat with the threat of another strike as we get into the start of 2025.
Speaking of the recent shut down of port activity, it will take a week or so to work through the container backlog. This, along with the disruption in shipping patterns caused by the recent hurricanes, has been impacting tender rejection rates as seen in Figure 2.1.
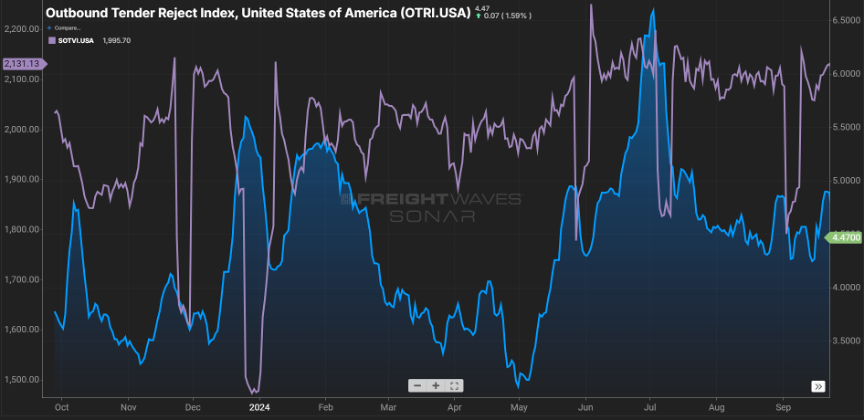
Rejection rates crested the five percent mark recently. As port activity comes back online, expect the volume for short haul shipments (<250 miles) to remain elevated as also seen in Figure 2.1.
Stay Up To dAte
Looking for a more frequent update? Subscribe to our newsletter and receive the top five logistics articles of the week every Friday morning by selecting “Weekly News Update” when you select your preferences.
Get Weekly News Updates in Your InboxStay up to date on the latest information on conditions impacting the freight market, curated by Trinity Logistics through our Freightwaves Sonar subscription.
YES, IT IS IMPORT-ANT
There has been much buzz in the last month around inbound container volumes to U.S. ports. There are 300+ ports of entry for goods into the country, with much of that volume handled by the top 20. Most of that buzz is around the uptick in volume.
In figure 1.1, you will see for the port of Los Angeles, the largest in the country, that container volume is up almost 38 percent. That’s certainly impressive, but the neighboring port (Long Beach) was up a staggering 60 percent.

Many would anticipate this similarly impacting the outbound over-the-road volume for that market. And yes, while we see in Figure 1.2 via the blue line, there is a noticeable increase from what it was heading into the Memorial Day holiday, but it is not a direct correlation. The beige line represents the domestic rail volume from that same market, and unlike what we experienced in the “Covid years”, the rails have been a bigger mover of goods versus the bottlenecks we saw back then.

We should expect to see import volumes continue through the next few months. As goods produced overseas have become cheaper to buy, major retailers have taken advantage of these discounts with the anticipation of robust consumer spending. Remember, almost three-fourths of inbound volume is directly related to consumer purchasing. Good news for consumers as these retailers will want to liquidate this inventory quickly at lower prices.
NOT FAR FROM HEALTHY
While not in balance, the spread between contract and spot rates continues to shrink, now sitting about $0.60 per mile higher on the contract side. Keep in mind this gap was in the $0.75 to $0.90 for much of the past year. Almost in lockstep has been the tender rejection index. It has continued its slow upward movement as seen by the green line in Figure 2.1.

This can be attributed to capacity continuing to shrink slightly (Figure 2.2) and contract rates moving downward. It’s rare that spot rates will eclipse contract rates, but a spread of $0.40 to $0.50 is indicative of a healthier market, and we are not far from that right now.

I spent a few days traversing the state of Tennessee recently. At one stretch of a major interstate, there was a back-up at least five miles long. Luckily for me, it was on the eastbound side, and I was heading the opposite direction.
What struck me was the sheer number of trucks that sat idled. By my estimates, almost 80 percent of the volume was truck traffic. And while you can’t tell if a van is loaded or not, every single flatbed had freight on it. So, ladies and gentlemen, freight is still moving in this country. While it may not feel like it, volumes are trending close to 2022 levels as seen in Figure 3.1 (blue vs. green line). They say the fourth quarter is the time when carriers make hay; so here’s to an optimistic outlook for the next four months.

Stay Up To dAte
Looking for a more frequent update? Subscribe to our newsletter and receive the top five logistics articles of the week every Friday morning by selecting “Weekly News Update” when you select your preferences.
Get Weekly News Updates in Your InboxStay up to date on the latest information on conditions impacting the freight market, curated by Trinity Logistics through our Freightwaves Sonar subscription.
GOOD NEWS, BUT…
Consumer spending is the biggest driver of the U.S. economy, accounting for roughly two-thirds of the nation’s Gross Domestic Product (GDP). One measurement of that consumer spending is the Redbook index, which compares year-over-year growth for large domestic general retailers (think Walmart, Amazon, Target). The index has averaged just over 3.5 percent for the past 20 years, so the recent year-over-year (YoY) growth in the four-plus percent range speaks to the strength of consumer spending (Figure 1.1). This index alone certainly gives reason for optimism, however there is a cautionary tale with regards to consumer debt.
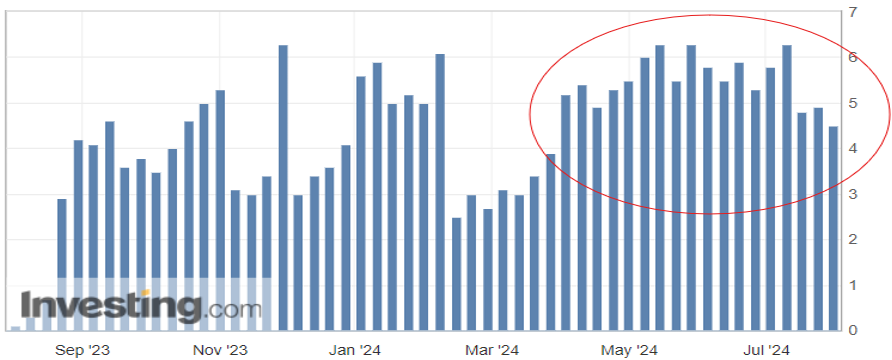
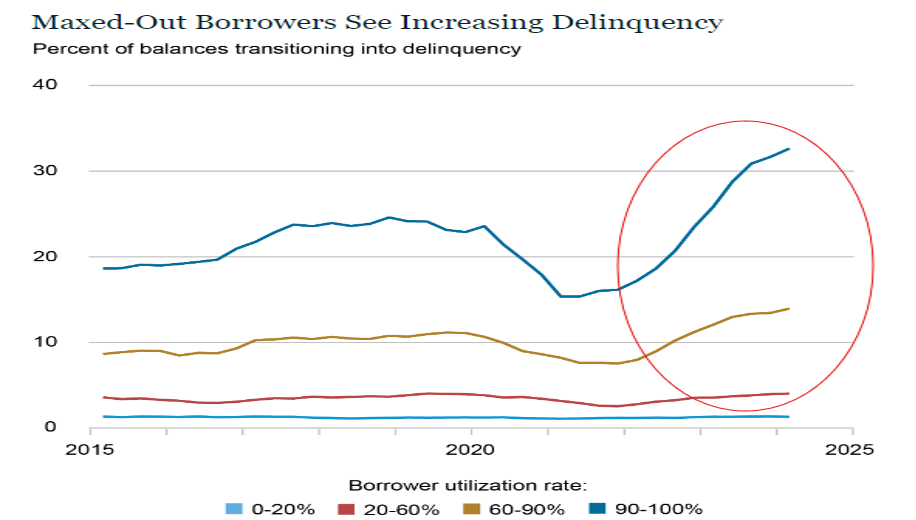
After years of next to zero interest rates to keep the economy on its legs, consumers have seen interest rates on the rise, with the federal funds rate at its highest level since the early 2000’s. With the increase in interest to borrow funds, combined with the increased costs of essentials (food, housing, energy), many households have turned to credit cards to fill the gap for funding of these necessities. Figure 1.2 from the New York Fed Consumer Credit Panel shows the rise in consumer delinquency particularly in those groups that utilize more than half of their available credit line.
While there appears to be relief on the horizon with the impending reduction in interest rates, it appears a portion of active consumers may be pulling back on purchases for those items that are not mission critical. This, in turn, will have an impact on restocking of inventories and trucking activity.
While it is not approaching the levels seen in 2021, the volume index is quickly approaching levels seen in 2022. This has buoyed optimism in the industry.
JUST SOME GOOD LUCK? TIME WILL TELL
The uptick in consumer spending, restocking of inventories and the threat of labor strife in the fourth quarter of this year has been to the benefit of those involved with the rail and import business.
In Figure 2.1 below, the blue line represents loaded container rail volume in the U.S. and the past three months have seen the volume grow. Similarly, container volumes to the U.S. have been on the rise.
The orange line represents container volume from China over the past six months. While some of that traditional volume is now flowing through other countries, like Mexico, there is still a great deal of activity with U.S.-China trade. Will this continue or is it fool’s gold? That is something we will continue to keep an eye on as a pullback in consumer spending will dictate how the needle moves.

STAYING RIGHT WHERE WE ARE
Finally, looking at domestic over-the-road volume (blue line) compared with carrier rejection rates (green line). The slight upward trend continues with volumes and rejection rates (Figure 3.1). Rejection rates continue to inch towards 2022 levels, but a five-to-six rejection rate is about half of what one would see in a balanced freight market.
This has yet to manifest itself in the way of increased freight rates, as capacity still exists in the market.Shippers and carriers should anticipate little change in conditions (although hurricane season is looming) until early 2025.

Stay Up To dAte
Looking for a more frequent update? Subscribe to our newsletter and receive the top five logistics articles of the week every Friday morning by selecting “Weekly News Update” when you select your preferences.
Get Weekly News Updates in Your InboxThere was over two feet of rain and an estimated $18 billion in damages as Tropical Storm Florence pummeled the Carolinas and other parts of the Atlantic. There were 691,000 customers without power and water had closed parts of Interstate 95. As Florence pushed on in the United States, Typhoon Mangkhut hit the Philippines that Saturday and then China on Sunday, causing an estimated cost impact on Hong Kong’s gross domestic products of $627 million per day. Although devastating, these side-by-side catastrophic events are seemingly becoming a norm.
The last two decades have brought about increasingly destructive natural disasters. From Hurricanes Katrina and Sandy to the eruption of Eyjafjallajokull volcano in Iceland to the earthquake and tsunami in Japan. Along with widespread devastation to their physical surroundings, each of these natural disasters has impacted business operations in many cases on a global scale.
Over the years, climate changes are happening at a faster pace than originally anticipated. This has resulted in rising sea levels, which coincides with more severe storms, temperature swings, and volatile precipitation. Because of this, we have seen and will likely continue to see more intense weather that will have greater destructive potential, according to the National Oceanic and Atmospheric Administration (NOAA).
In this blog, we’ll go over the economic and supply chain impacts that result from these events and how you can best prepare your supply chain.
Impacts on the economy and supply chains
Severe weather has exponential impacts on our global economy. According to Aon Benfield’s 2016 Global Climate Catastrophe Report, the world saw $210 billion (USD) in economic losses because of 315 separate natural disasters. That’s 21 percent above the 16-year average of $174 billion (USD).
In 2017, Hurricane Harvey victims saw over 178,000 homes lost, $669 million in damages of public property, around a quarter million vehicle losses, $200 million in Texas crop in livestock losses…and the list goes on.
Additionally, businesses saw significant and expensive losses due to flooding, electrical outage, and employees’ inability to get to work, all causing temporary disruption of the flow of goods and services.
But the impacts of natural disasters reach far beyond the local damages of affected areas. When these natural events happen, numerous businesses find their supply chains shook.
The Tohoku Earthquake and Tsunami in Japan and the Thailand Floods in 2011 are both examples of natural disasters that had a much wider indirect economic effect. Both disasters caused severe disruption to global technology supply chains.
After the Thai floods, there was a global shortage of computer hard drives that sent consumer prices skyrocketing until factories were able to get back up and running. When the 2011 tsunami struck, several major car manufacturers were forced to shut down production at factories throughout Europe and the U.S. due to a lack of available parts from factories in Japan, setting off a supply chain reaction that impacted multiple suppliers of parts throughout the wider global economy.
Snowstorms are also a culprit of transportation delays and supply chain worries. If weather conditions drop below a certain temperature truck engines will not start, quickly accumulating snow may mean railroads might not be able to clear the tracks fast enough and snow and ice can make it impossible for planes to travel safely. All causing disrupted supply chains across the country.
Preparing your supply chain
With the increase of natural disasters, ensuring that your business is prepared for the potential disruption is very important. Disaster planning needs to consider not just the direct impact to your infrastructure, but how the after-effects of events far away from your base of operations could affect your supply chain and markets.
Create a disaster preparedness plan
Have a plan ready that outlines what to do in case of emergencies and natural disasters. This plan should take into consideration all types of weather and natural disaster your area is most susceptible to, and perhaps some that would particularly be considered unlikely. Snow in Florida? Probably not, but hey, with climate change you never know. Also, be sure to ask companies you partner with for their disaster plans to ensure alignment with risk management.
Monitor for threat
Supply chain risk management works best when companies have the earliest possible notice of potential disruptive impacts. Keeping up with potential weather, running a data analysis, and running simulations across your supply chain to identify pressure points where natural disasters would most likely impact your operations are all ways to keep up with your disaster preparedness plan.
Be transparent and flexible
Many natural disasters may be impossible to predict (earthquakes, wild fires, etc.) so disruption may be inevitable. Be open with members of your team and companies you partner with about how weather or natural disaster may affect capacity and your company’s supply chain. Additionally, think about substitute work spaces and methods of transport for your goods.
It’s never too early to revisit your risk management and disaster preparedness plans. As we all know, disaster can strike at any moment. At Trinity, we work with a network of over 70,000+ carriers and we’re always looking at the state of the industry and communicating with our customers.
If you’re looking to partner with a 3PL to help manage your supply chain or help your business, fill out our quick form.