Stay up to date on the latest information on conditions impacting the freight market, curated by Trinity Logistics through our Freightwaves Sonar subscription.
What to Expect in the Short-Term
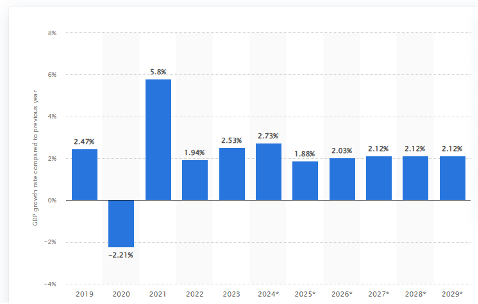
Well, so much for a recession. The U.S. is anticipating year-over-year growth of 2.8 percent in 2024 with regards to gross domestic product (GDP). That percentage of growth appears to be trending less in calendar 2025, with moderate growth forecast through the end of 2029 (Figure 1.1).
Generally, for every one percent of GDP growth, that typically translates into 1.5 percent growth in over-the-road truckload volume. Based on those projections, we expect freight volumes to climb by four to five percent in the coming year.
Conditions are also turning more favorable for a pendulum swing to the side of the carriers. Two reasons for the bullish outlook – dwindling capacity and tariffs (be it threat or real), simple supply and demand.
INCHING CLOSER TO BALANCE
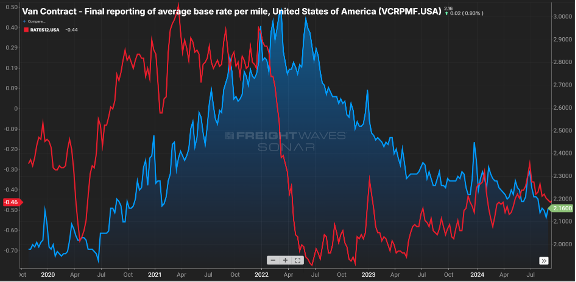
On the capacity side, the spread between contract and spot rates, which was near $0.80 per mile in the middle of 2022, has now fallen below $0.50 per mile. Keep in mind contract is almost always above spot sans latter 2020 and early 2021.
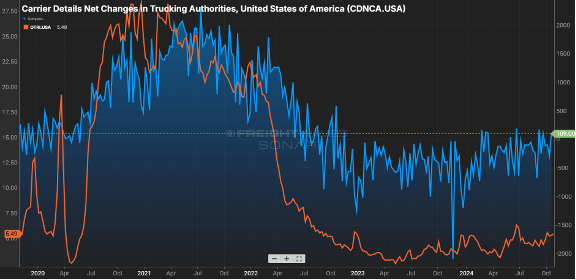
The gap has closed primarily due to contract rates receding, from the $2.30 range in early ’24 to now being $0.15 less, as illustrated by. Figure 2.. Figure 2.2 shows the net change in for-hire carriers versus the tender rejection rate. Since mid-2022, carriers have started to shun the market as higher costs to operate & lower rates made sustainability a challenge.
Where does shrinking capacity first show up? In the tender rejection rates. Carriers will say no to a guaranteed rate load either because they have no equipment in the area or there is a more favorable paying load available.
Rejection rates cresting the five percent mark may not sound significant, but keep in mind rejection rates were in the two to three percent range as we started this calendar year. Eight to 10 percent is a more balanced market, and we are close to that. Usually, rejection rates in double digits signify more pricing leverage is held by the carrier community.
The other driving factor is around demand. While there are some sectors showing slight gains, the November election could be the spark that drives a glut of freight movement.
With Republicans poised to control the White House and Congress, impending tariffs will drive a flurry of activity as shippers look to move goods prior to an imposed increase in cost, This is likely a short-term surge as “too much inventory” is a real thing, and once tariffs are imposed, consumers ultimately will feel the brunt of increased costs and could hamper purchasing. However, the next pivot point will be around movement of production to domestic U.S. or near-shore locations.
After a blah few years, things are about to get interesting.
Stay Up To dAte
Looking for a more frequent update? Subscribe to our newsletter and receive the top five logistics articles of the week every Friday morning by selecting “Weekly News Update” when you select your preferences.
Get Weekly News Updates in Your InboxStay up to date on the latest information on conditions impacting the freight market, curated by Trinity Logistics through our Freightwaves Sonar subscription.
Feels like 2022
For the majority of this year, volumes have seen their traditional seasonal patterns and have been trending above 2023 levels. Many have commented that market balance will be driven more by carrier attrition versus an event that spurs freight volumes.
2022 was a pretty good year from an industry standpoint. Volumes were still elevated (certainly not like we saw in 2021) and capacity was inline. While it may be a blip on the radar, we have now seen the Outbound Tender Volume Index eclipse 2022 levels for the first time in two years as seen in Figure 1.1.
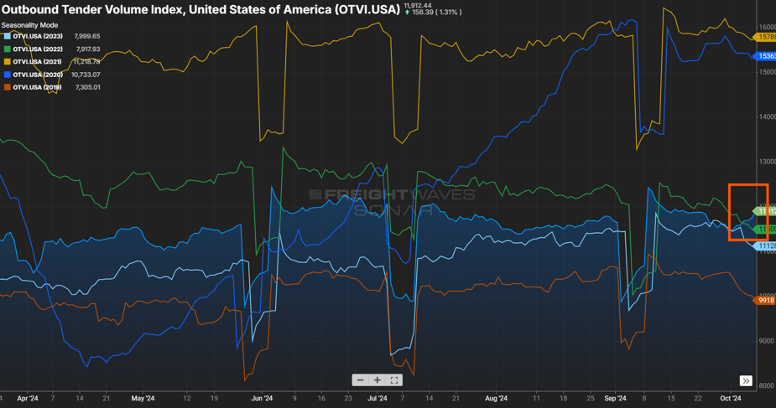
I think it is still too early to pin the volume uptick on the interest rate reduction or the recent hurricanes that severely impacted states in the southeast, but these events, and any potential storms that might still pop up (hurricane season isn’t quite over yet), could impact freight volumes in the coming months. Combined with consumers continuing to spend, volumes could remain consistent through the end of the year versus following their traditional end of year downward movement.
FINE….FOR NOW
While there was a sigh of relief from many with the ILA and USMX reaching a deal on wage increases for dock workers, this does not mean that everything is resolved, and potential port disruptions could occur at the 20-something docks along the East and Gulf coast.
Union-member wages were the major bargaining chip that was agreed upon last week, with dock workers receiving an immediate pay increase, with yearly pay increases to follow. When all increases have taken effect, dock workers will see a 62 percent increase in pay. One issue that was not finalized was the use of automation at select ports, which the labor union has opposition to full and semi-automation. The two sides will continue their negotiation discussions, with a timetable of three months from now to finalize a deal.
If these points can’t be resolved, it may be rinse and repeat with the threat of another strike as we get into the start of 2025.
Speaking of the recent shut down of port activity, it will take a week or so to work through the container backlog. This, along with the disruption in shipping patterns caused by the recent hurricanes, has been impacting tender rejection rates as seen in Figure 2.1.
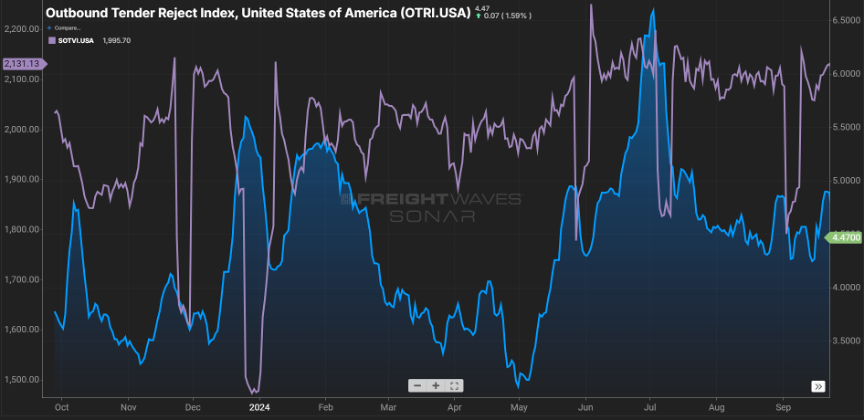
Rejection rates crested the five percent mark recently. As port activity comes back online, expect the volume for short haul shipments (<250 miles) to remain elevated as also seen in Figure 2.1.
Stay Up To dAte
Looking for a more frequent update? Subscribe to our newsletter and receive the top five logistics articles of the week every Friday morning by selecting “Weekly News Update” when you select your preferences.
Get Weekly News Updates in Your InboxStay up to date on the latest information on conditions impacting the freight market, curated by Trinity Logistics through our Freightwaves Sonar subscription.
YES, IT IS IMPORT-ANT
There has been much buzz in the last month around inbound container volumes to U.S. ports. There are 300+ ports of entry for goods into the country, with much of that volume handled by the top 20. Most of that buzz is around the uptick in volume.
In figure 1.1, you will see for the port of Los Angeles, the largest in the country, that container volume is up almost 38 percent. That’s certainly impressive, but the neighboring port (Long Beach) was up a staggering 60 percent.

Many would anticipate this similarly impacting the outbound over-the-road volume for that market. And yes, while we see in Figure 1.2 via the blue line, there is a noticeable increase from what it was heading into the Memorial Day holiday, but it is not a direct correlation. The beige line represents the domestic rail volume from that same market, and unlike what we experienced in the “Covid years”, the rails have been a bigger mover of goods versus the bottlenecks we saw back then.

We should expect to see import volumes continue through the next few months. As goods produced overseas have become cheaper to buy, major retailers have taken advantage of these discounts with the anticipation of robust consumer spending. Remember, almost three-fourths of inbound volume is directly related to consumer purchasing. Good news for consumers as these retailers will want to liquidate this inventory quickly at lower prices.
NOT FAR FROM HEALTHY
While not in balance, the spread between contract and spot rates continues to shrink, now sitting about $0.60 per mile higher on the contract side. Keep in mind this gap was in the $0.75 to $0.90 for much of the past year. Almost in lockstep has been the tender rejection index. It has continued its slow upward movement as seen by the green line in Figure 2.1.

This can be attributed to capacity continuing to shrink slightly (Figure 2.2) and contract rates moving downward. It’s rare that spot rates will eclipse contract rates, but a spread of $0.40 to $0.50 is indicative of a healthier market, and we are not far from that right now.

I spent a few days traversing the state of Tennessee recently. At one stretch of a major interstate, there was a back-up at least five miles long. Luckily for me, it was on the eastbound side, and I was heading the opposite direction.
What struck me was the sheer number of trucks that sat idled. By my estimates, almost 80 percent of the volume was truck traffic. And while you can’t tell if a van is loaded or not, every single flatbed had freight on it. So, ladies and gentlemen, freight is still moving in this country. While it may not feel like it, volumes are trending close to 2022 levels as seen in Figure 3.1 (blue vs. green line). They say the fourth quarter is the time when carriers make hay; so here’s to an optimistic outlook for the next four months.

Stay Up To dAte
Looking for a more frequent update? Subscribe to our newsletter and receive the top five logistics articles of the week every Friday morning by selecting “Weekly News Update” when you select your preferences.
Get Weekly News Updates in Your InboxStay up to date on the latest information on conditions impacting the freight market, curated by Trinity Logistics through our Freightwaves Sonar subscription.
GOOD NEWS, BUT…
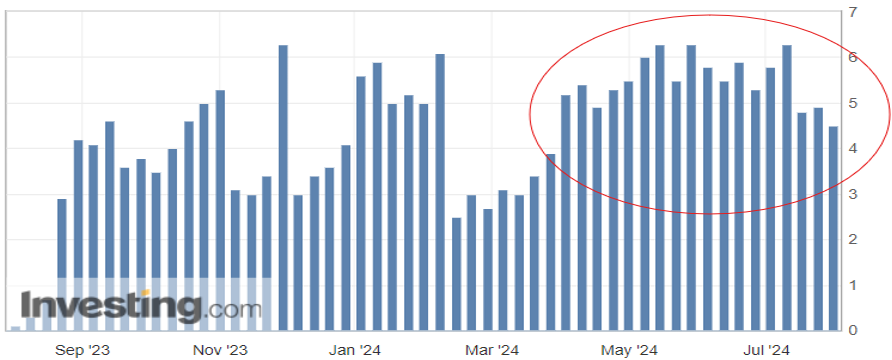
Consumer spending is the biggest driver of the U.S. economy, accounting for roughly two-thirds of the nation’s Gross Domestic Product (GDP). One measurement of that consumer spending is the Redbook index, which compares year-over-year growth for large domestic general retailers (think Walmart, Amazon, Target). The index has averaged just over 3.5 percent for the past 20 years, so the recent year-over-year (YoY) growth in the four-plus percent range speaks to the strength of consumer spending (Figure 1.1). This index alone certainly gives reason for optimism, however there is a cautionary tale with regards to consumer debt.
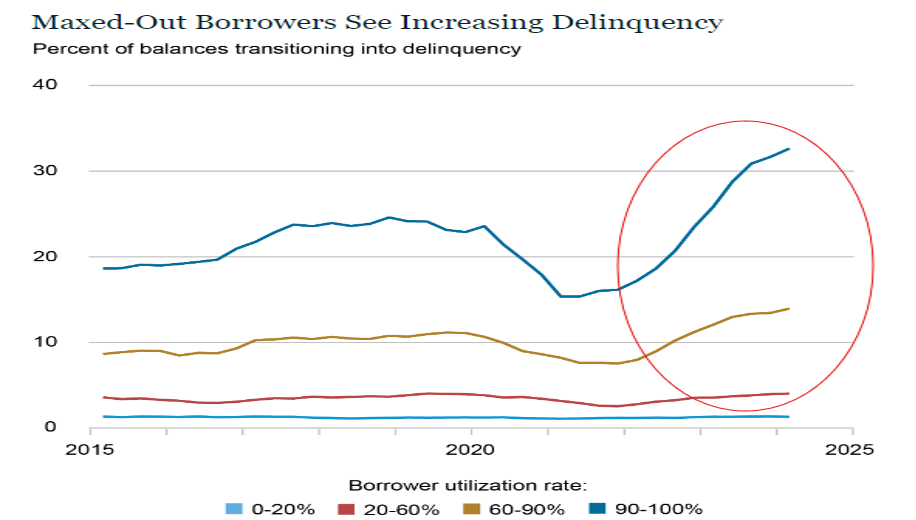
After years of next to zero interest rates to keep the economy on its legs, consumers have seen interest rates on the rise, with the federal funds rate at its highest level since the early 2000’s. With the increase in interest to borrow funds, combined with the increased costs of essentials (food, housing, energy), many households have turned to credit cards to fill the gap for funding of these necessities. Figure 1.2 from the New York Fed Consumer Credit Panel shows the rise in consumer delinquency particularly in those groups that utilize more than half of their available credit line.
While there appears to be relief on the horizon with the impending reduction in interest rates, it appears a portion of active consumers may be pulling back on purchases for those items that are not mission critical. This, in turn, will have an impact on restocking of inventories and trucking activity.
While it is not approaching the levels seen in 2021, the volume index is quickly approaching levels seen in 2022. This has buoyed optimism in the industry.
JUST SOME GOOD LUCK? TIME WILL TELL
The uptick in consumer spending, restocking of inventories and the threat of labor strife in the fourth quarter of this year has been to the benefit of those involved with the rail and import business.
In Figure 2.1 below, the blue line represents loaded container rail volume in the U.S. and the past three months have seen the volume grow. Similarly, container volumes to the U.S. have been on the rise.
The orange line represents container volume from China over the past six months. While some of that traditional volume is now flowing through other countries, like Mexico, there is still a great deal of activity with U.S.-China trade. Will this continue or is it fool’s gold? That is something we will continue to keep an eye on as a pullback in consumer spending will dictate how the needle moves.

STAYING RIGHT WHERE WE ARE
Finally, looking at domestic over-the-road volume (blue line) compared with carrier rejection rates (green line). The slight upward trend continues with volumes and rejection rates (Figure 3.1). Rejection rates continue to inch towards 2022 levels, but a five-to-six rejection rate is about half of what one would see in a balanced freight market.
This has yet to manifest itself in the way of increased freight rates, as capacity still exists in the market.Shippers and carriers should anticipate little change in conditions (although hurricane season is looming) until early 2025.

Stay Up To dAte
Looking for a more frequent update? Subscribe to our newsletter and receive the top five logistics articles of the week every Friday morning by selecting “Weekly News Update” when you select your preferences.
Get Weekly News Updates in Your Inbox