Stay up to date on the latest information on conditions impacting the freight market, curated by Trinity Logistics through our Freightwaves Sonar subscription.
From Peak to Plummet
Last month, we talked about the rise in import volumes and speculated on the impact of new tariffs or expiring pauses on current tariffs. Unfortunately, that came true in July, with import volumes dropping sharply as indicated in Figure 1.1. While import volumes have been up year-over-year for the first half of 2025, projections based on tariff impacts forecast a much lower second half.
Overall, the U.S. is forecasting an almost six percent reduction compared to last year. Yes, lower product demand attributed to rising costs is one driver of the YoY decline. But you may remember the tail end of 2024 saw a surge in import volumes due to the lack of certainty around labor issues at the East and Gulf coast ports, making the comps for the latter part of 2025 much more challenging.
With 136 days until Christmas, and based on anticipated cancelled and blank sailings, it may be wise to bundle your Christmas and Back-to-School shopping all in one.

PLENTY OF DRIVERS, BUT NOt DRIVING UP RATES
Overall carrier capacity continues to be fruitful, with August seeing a spike in net operating authorities as evidenced by Figure 2.1. This has driven down what was an escalating tender rejection rate over the last two months, with carriers saying “yes” to freight tendered their way almost 95 percent of the time.
With no reason to expect a surge in freight demand over the remainder of the calendar year, rejection rates remaining low will continue to keep carrier rates stagnant. 60 days ago, spot rates for carriers sat at $2.27. Today, that number is $2.28.
In general, the over-the-road freight market can be described like my golf game, “eehhhh”.

Stay Up To dAte
Looking for a more frequent update? Subscribe to our newsletter and receive the top five logistics articles of the week every Friday morning by selecting “Weekly News Update” when you select your preferences.
Get Weekly News Updates in Your InboxStay up to date on the latest information on conditions impacting the freight market, curated by Trinity Logistics through our Freightwaves Sonar subscription.
A TICKING TRADE CLOCK
Import volumes continue to rise, but for how long? Since the 90-day truce with China in early May, U.S. ports have continued to see volumes that rival and surpass those seen over the past few years (Figure 1.1).
While Chinese imports are a big driver of those volumes, they are not the only country feeding freight through our borders. A year-over-year (YoY) increase of four percent in shipment volume from China is nothing to sneeze at, but countries like Vietnam (52 percent YoY increase), Thailand (51 percent), and India (43 percent) have become more pronounced in their shipment volumes destined for the U.S.
With the 90-day pause now being extended until August 1st, it’s anticipated that volumes will remain elevated, but if tariffs are re-instituted, expect to see blank sailings and less volume coming through our ports, particularly the West Coast.

NOT YOUR AVERAGE SUMMER SLOWDOWN
While import volumes continue to surge, that volume is not translating to over-the-road shipments for the trucking industry.
As Figure 2.1 shows, the outbound volume index has remained relatively flat with the normal peaks and valleys for holiday periods. One area we are closely watching is the movement in the tender rejection index, the rate at which carriers are saying “No thank you” to shipments being tendered to them.
During the latter part of June and early July, rejections trended upward, cresting the eight percent mark. While that has seen a dip in the past few days, as have volumes, it’s anticipated to rebound to those levels in the coming weeks.
As most Americans tend to do, truck drivers also take advantage of the summer months for vacation time. Combined with the continuing trend of carriers leaving the market, and the still-to-be-determined impact of the English Language Proficiency mandate and enforcement, even if freight volumes are stagnant, less drivers to haul those shipments will cause rejections, and most likely rates, to rise.

REJECTION TRENDS BY EQUIPMENT
And speaking of tender rejections, not all rejections are created equally. There are many factors that influence a shipment being rejected by a carrier, one of which is the equipment required.
As Figure 3.1 shows, the rejection rate for shipments requiring a van (blue line) have been relatively flat. Flatbed (white line) capacity was a struggle in the spring months, but while still relatively high, at 15 percent, much less than what was experienced a few months ago.
Reefers continue to slowly trend upward, and produce seasonality has an influence this time of year, with one out of every nine shipments seeing the carrier reject the shipment opportunity.
Understanding what the trends are by equipment type will help as you are working on spot versus contract priced shipments.

Stay Up To dAte
Looking for a more frequent update? Subscribe to our newsletter and receive the top five logistics articles of the week every Friday morning by selecting “Weekly News Update” when you select your preferences.
Get Weekly News Updates in Your InboxStay up to date on the latest information on conditions impacting the freight market, curated by Trinity Logistics through our Freightwaves Sonar subscription.
Exit Stage Left
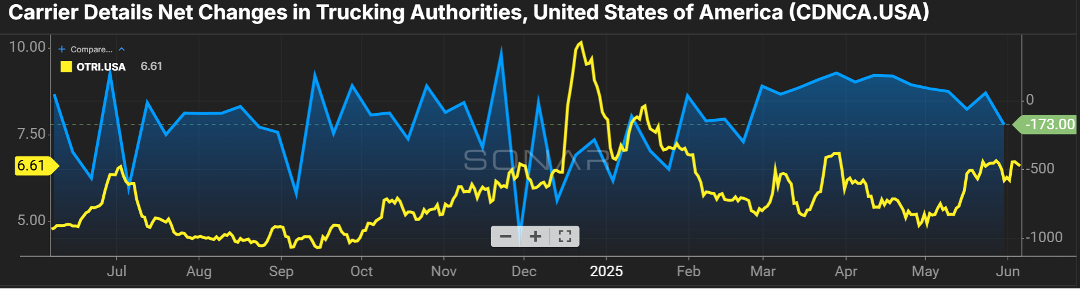
The slow but consistent exit of carriers from the freight market continues.
Figure 1.1 shows a theme of negative net authorities in the for-hire carrier market thus far in 2025. This continues the trend from last year, when there were 13,000 fewer carriers in the market at the end of the year versus compared to the start, an almost four percent decrease. Operating costs, tariff-related increases in equipment and parts, and a stricter mandate on driver proficiency in English will continue to negatively impact the number of drivers and carriers in the market.
Where this impact will be most pronounced is the tender rejection rate, the frequency in which carriers say “no thank you” to a shipment offered to them. I don’t foresee the rejection rates we experienced in the latter part of ’20 and all of ’21, which were in the 20-30 percent range, happening. However, we are quickly approaching double-digit rejection rates which would signal a more balanced supply and demand freight market.
Shippers have been working with the luxury of not having to reach too far into their routing guides and carrier and broker partners. As the recent trends continue, freight acceptance compliance will become more challenging for them.
West Coast Ports Heat Up Again
The one thing that is somewhat unpredictable right now is import volumes and their impact on the freight market.
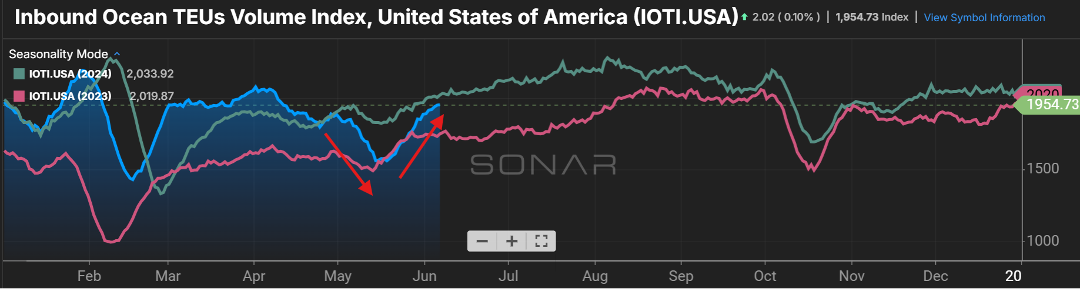
Figure 2.1 shows the slowdown of freight from overseas, most of which affected our West Coast ports. Once a handshake deal was in place to stave off steep tariffs with China, ships pulled up their anchors and chugged across the waters destined for the U.S.
Import volumes have recently surpassed 2023 levels and are soon to close in on 2024 volumes. Most of this freight will be more of a “just in case” scenario versus “just in time”. This will see a greater benefit to the rail industry versus truckload market, as freight that is not time sensitive has the luxury of taking longer to arrive at its destination at a lower cost.
Expect to see some volatility in truckload pricing in and around the LA/LB ports as capacity and freight volume imbalances collide.
Stay Up To dAte
Looking for a more frequent update? Subscribe to our newsletter and receive the top five logistics articles of the week every Friday morning by selecting “Weekly News Update” when you select your preferences.
Get Weekly News Updates in Your InboxStay up to date on the latest information on conditions impacting the freight market, curated by Trinity Logistics through our Freightwaves Sonar subscription.
Freight in Retreat
A picture is worth a thousand words.
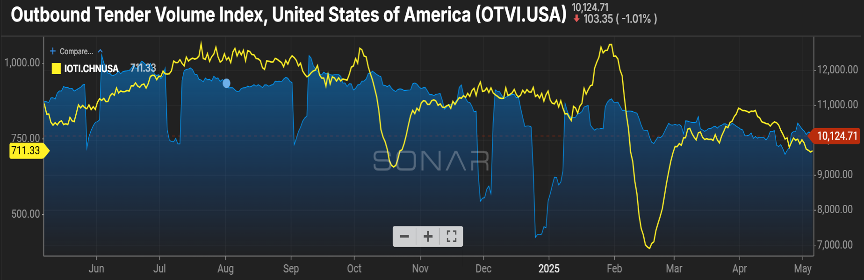
Figure 1.1 shows the initial impacts of the tariffs with regard to ocean containers and over-the-road trucking volumes. As you see by the yellow line, shippers were eager to get ahead of the pending tariffs with freight from China. But as the tit for tat trade war has continued, blank sailings and cancelled bookings are becoming common and has caused inbound container volume to trend downward, now sitting almost 20 percent less than this time last year.
This has translated into a regression in the over-the-road trucking volume, with the blue line starting to show a decline at time of year when freight volumes should be escalating with increased consumer activity and the start of produce season. Additionally, the lack of container volume has an impact on rail activity with total intermodal container volume receding five percent from where it was in March.
Carriers Struggle with Freight Shift
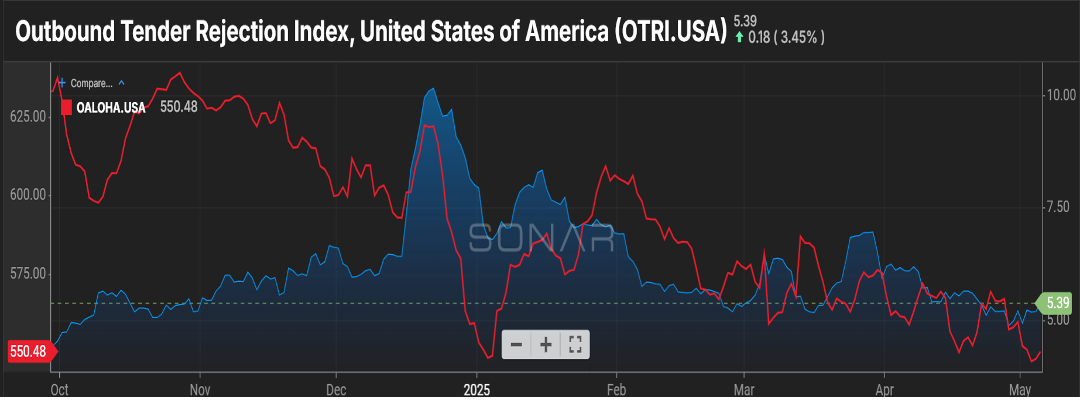
The rejection of freight tenders (OTRI.USA) has been relatively unchanged over the past month plus. This has been held up by a declining base of carriers. However, if you look at Figure 2.1 you will see via the red line that the average length of haul for shipments has been on a steady decline pretty much for the past year.
Yes, less import traffic plays into that, as those shipments typically head to larger metro areas (Chicago, Dallas) once they cross into our borders at the port. But a push for regionalization by shippers and an increase in e-commerce activity has also fueled more frequent but shorter distances for freight to travel, down about 12 percent from this time in 2024.
This is not great news for carriers as 75 miles less equates to a lower price they can command, but the mileage difference is not enough to allow them to compensate for the difference by additional freight moves during their work week.
Tariffs Price Out Small Carriers
The length and severity of the tariffs is not only having an immediate impact on trucking volumes, but it could be setting the industry up for a capacity shortage once calmer waters prevail. 25 percent tariffs on Mexican and Canadian imports have increased the cost of new trucks by almost $30,000, making it particularly challenging for smaller carriers to invest in new equipment, let alone new entrants to enter the carrier capacity market.
And for those looking to stretch the mileage out of older equipment, the increased cost for maintenance parts and fuel additives as a result of tariffs puts further strain on already tight budgets. Considering 93 percent of the for-hire carriers in the U.S. are less than 10 trucks, there could be a gaping hole to fill in the spot market when a freight rebound happens.
Stay Up To dAte
Looking for a more frequent update? Subscribe to our newsletter and receive the top five logistics articles of the week every Friday morning by selecting “Weekly News Update” when you select your preferences.
Get Weekly News Updates in Your InboxStay up to date on the latest information on conditions impacting the freight market, curated by Trinity Logistics through our Freightwaves Sonar subscription.
tarifFS AND TIGHT WALLETS
A colleague of mine told me recently that anytime you give a presentation around technology, there is an obligation, almost a duty, to include “AI”. Now, it feels like anytime you talk or write about things in the freight market, you have to include the word “tariffs”. The old saying, if you don’t laugh, you’ll cry seems very appropriate.
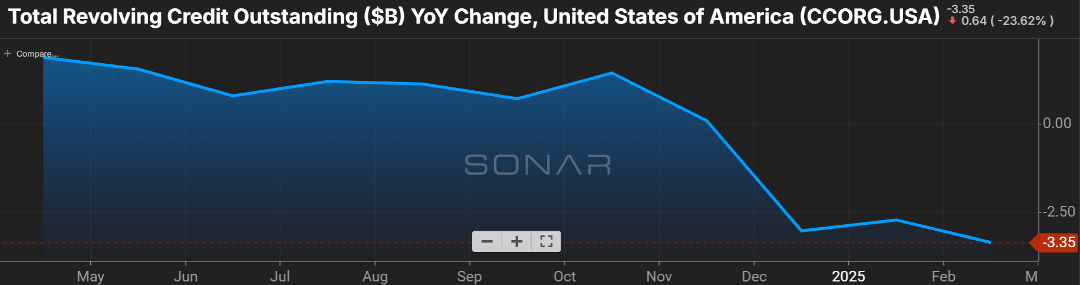
In 2024, 68 percent of personal consumer expenditures comprised our nation’s gross domestic product (GDP). This is concerning when you look at the trend over the last three months regarding consumer revolving credit.
As you can see below in Figure 1.1, year-over-year (YoY) there has been a decline. When customers feel skittish about taking on a new car loan or signing on the dotted line for a thirty-year mortgage, this has a trickle-down effect, not just on the immediate sectors, like the auto industry and housing, but those secondary and tertiary markets. If the pace of new homes being bought slows, then production of things that go into the home, like furniture, carpet, or fixtures, is also impacted negatively.
Some have pointed to the credit card revolving debt as a sign of the economy’s strength. That may have been a valid argument in January, when we saw a six percent YoY gain. But the recent report shows an annualized bump of only 0.1 percent, indicating that consumers are curtailing spending and relying on cash at hand to fund purchases versus credit cards.
Don’t be surprised if long-term debt, like auto loans, starts to show an uptick in delinquency.
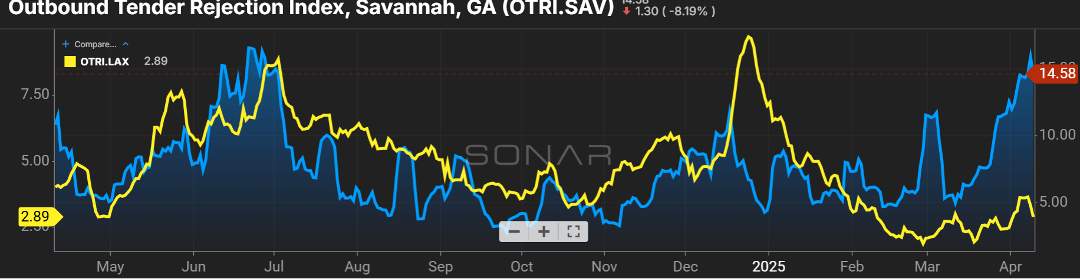
Tiny Shifts, but Big Waves
As the threat of the “T” word continues, the freight market continues to see the pull forward of goods entering the U.S. as shippers look to get ahead of an increase in production costs.
While a slight increase in port areas like Los Angeles may seem like no big deal (Figure 2.1), keep in mind over half of the import volume funnels through the LA/LB ports. Even going from a 2.5 percent rejection rate to now in the five percent range (yellow line) may not seem significant. However, when you apply that change to 413k shipments in February alone, it becomes a significant impact.
A port like Savannah (blue line) shows the impact of a fragile capacity balance, and even a slight uptick can be needle moving for rejection of freight tenders. While not to the size of the LA/LB ports, handling 265k import containers in March, a surge in volume of 30k containers compared to February 2025, an imbalance in capacity can quickly escalate rejection rates close to 15 percent as they stand currently.
Stay Up To dAte
Looking for a more frequent update? Subscribe to our newsletter and receive the top five logistics articles of the week every Friday morning by selecting “Weekly News Update” when you select your preferences.
Get Weekly News Updates in Your InboxStay up to date on the latest information on conditions impacting the freight market, curated by Trinity Logistics through our Freightwaves Sonar subscription.
Spring Thaw or Economic Chill? Key Indicators to Watch in 2025
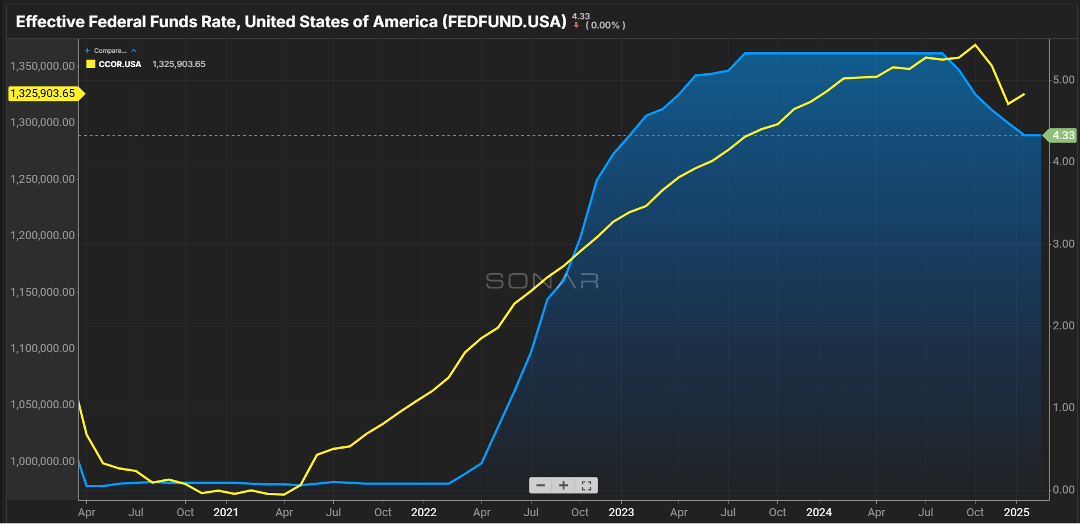
Normally we look at over-the-road or port volumes, what carrier rejections look like, and how that is impacting freight rates. This month, we’re going to shift a bit and look at things from more of an economic standpoint. The first chart, Figure 1.1, shows the federal funds rate and consumer debt. Consumer spending accounts for a large portion of GDP with dollars they spend on things as well as services.
The latter part of 2024 saw multiple cuts to interest rates. However, the expectation heading into 2025 was that any relief on rates would not be seen until the second half of the year as typically those who make the decisions take a bit of a ‘wait-and-see’ approach as there were several new players on the committee in their first meeting.
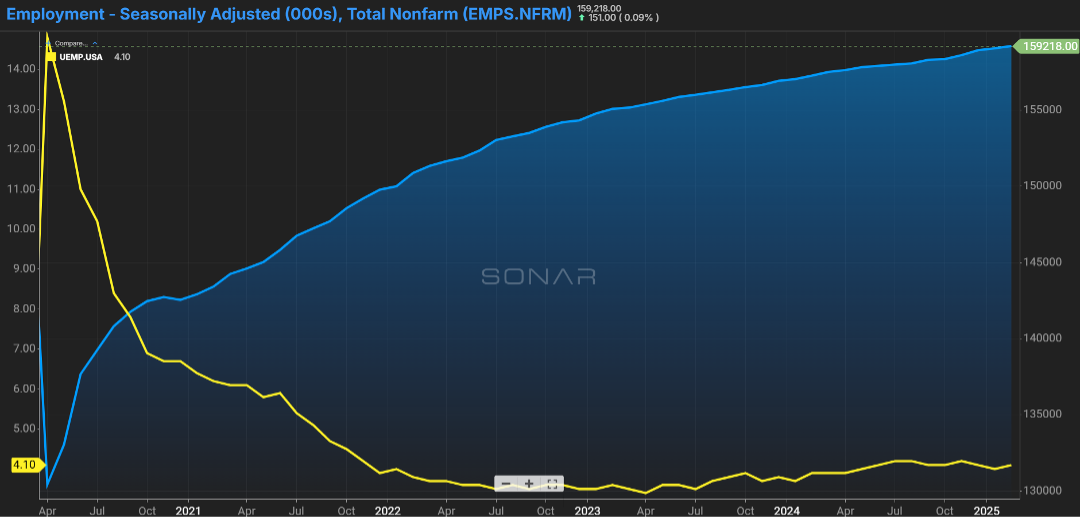
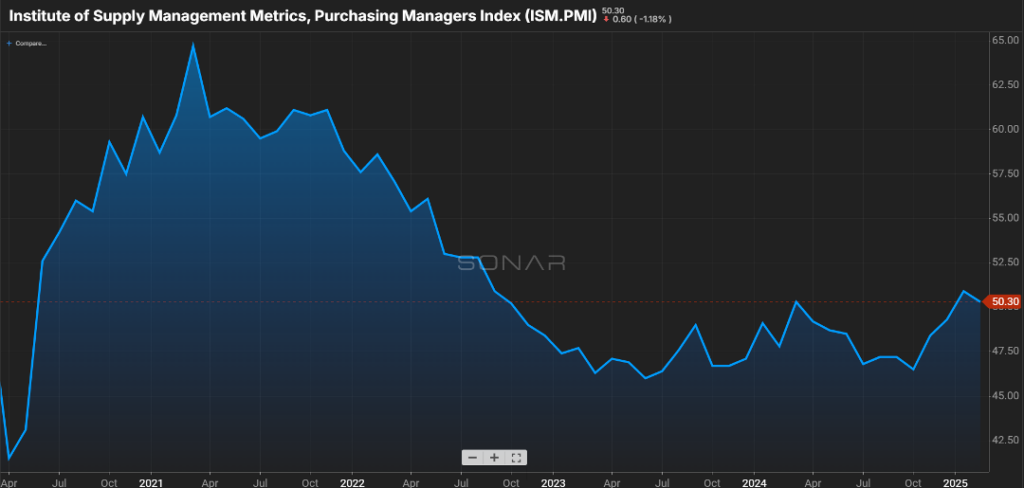
One area that members of the committee look toward is the strength of the labor market. While the jobs report showed numbers for the first two months of the year slightly below the forecast, the unemployment rate continued to hover in the 4% range (Figure 2.1). Another encouraging sign is the slight increase in jobs across the manufacturing and construction sectors. Coupled with the ISM breaching the 50 mark, which is typically the point of determining positive versus negative sentiment in these industries, there is optimism as the Spring thaw begins (Figure 2.2).
I would be remiss if I did not mention recently enacted and pending tariffs. I think anyone that gives an update on the economy is now required to mention the “T” word. Things like steel, aluminum, and lumber that have been at the center of these talks are commodities that support manufacturing, and a decline in volume or an increase in the cost of these goods could hamper the manufacturing sector.
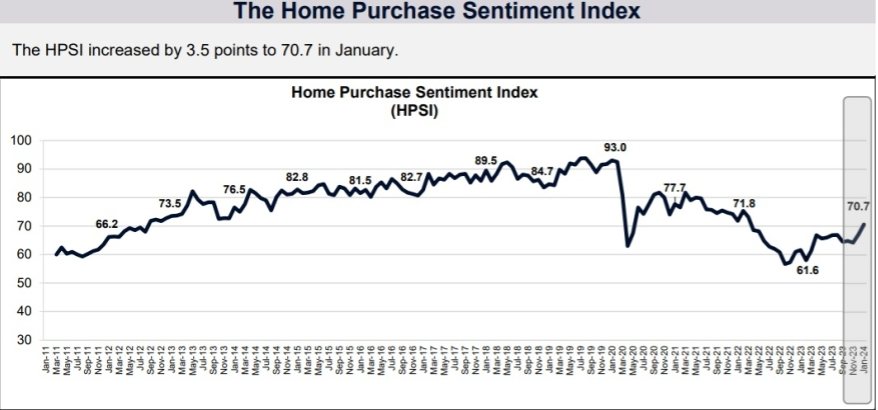
Another area in the news relates to home purchasing. Fannie Mae publishes the Home Purchase Sentiment Index, (Figure 3.1) which has shown a slight uptick in the last several months. Consumers who felt now was a good time to sell a home rose to 65 percent, up from 60 percent in January.
While the same cannot be said for those in the market to buy; only 19 percent of consumers felt it was a good time to buy., a modest increase from the end of 2024. Much of that optimism is based on anticipated relief with mortgage rates, something consumers believe the second half of the year will offer. Will we see rates of three percent that existed back in ’21 & ’22? Most likely, no, but rates in the five or six percent range can be a swing of several hundreds of dollars on a family’s monthly mortgage payment.
Stay Up To dAte
Looking for a more frequent update? Subscribe to our newsletter and receive the top five logistics articles of the week every Friday morning by selecting “Weekly News Update” when you select your preferences.
Get Weekly News Updates in Your InboxStay up to date on the latest information on conditions impacting the freight market, curated by Trinity Logistics through our Freightwaves Sonar subscription.
Tariffs, Trends, & Trade Routes
With the new administration in place, there has certainly been no shortage of headlines. Many have asked what the impact is, or potentially will be, on the freight market. I think many are leery of making changes to projections or providing advice on how to pivot because what happens today can turn on a dime tomorrow when it comes to U.S. policy.
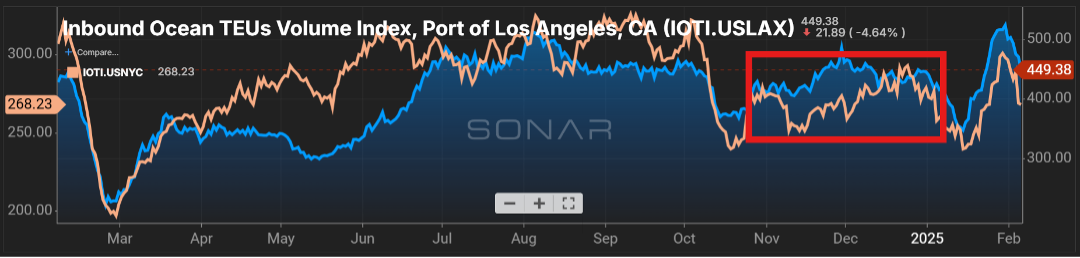
The one thing that appears certain is that many retailers pulled their inventory ahead in anticipation of tariffs being enacted. The last four months have seen a volume that outpaced the prior year. Figure 1.1 shows the container volume for Los Angeles (blue line) versus the port of New York/New Jersey. Particularly, the West Coast has seen an influx driven not just by the pull forward of volume, but the uncertainty with labor relations at the East Coast ports shifted volume west during the latter part of 2024 and early ’25.
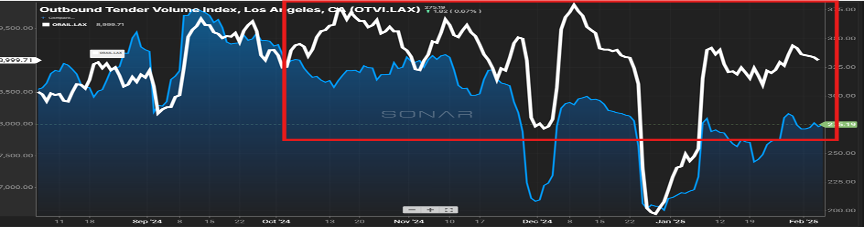
Unlike what was experienced several years ago, that increase in import volume has not translated to over-the-road moves. Figure 2.1 shows the last six months of volume handled by trucks out of the Los Angeles area versus the volume that has found its way to the rails. Unlike ’21 and ’22 when rails were a bit of the bottleneck for freight movement, they are much better positioned this time to handle the increase in volume. You can clearly see the gap in volume for rail (white line) versus truck (blue line), especially since early October.
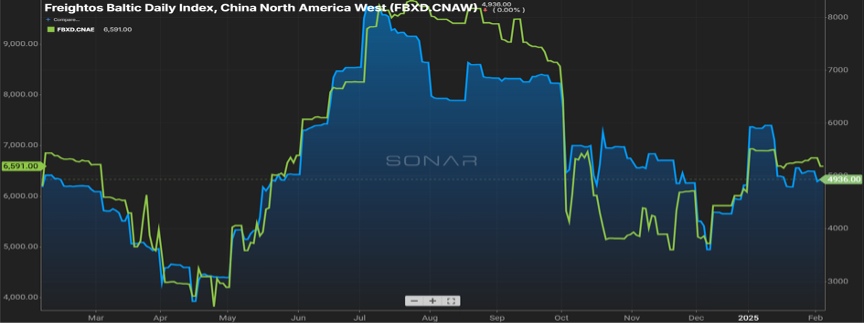
Speaking of imports, there appears to be a normalizing of the cost to procure containers for movement of goods into the U.S. Looking at Figure 3.1, the cost of a freight container from China to both the left and right side of the United States has retreated from its high during the summer months and shows a leveling out. Much of this is due to the decline seen in nefarious activity in and around the Red Sea. As calm has returned, ships are now able to utilize this corridor for transit, it has shaved transit times which in turn has opened up more ship capacity globally.
Price Hikes Ahead?
Finally, while tariffs have been the talk recently, certainly the who, what and when has been in a state of ebb and flow, one item that is not getting as much press is the scrapping of the de minimis exception. This has long been a shipping loophole for retailers that thrive on low-cost goods (think Temu or Shein). Unlike many retailers who paid millions, hundreds of millions, in duties and taxes, the companies of Shein and Temu paid a whopping $0 for all of 2024. This move now requires basically all inbound shipments to the U.S. to be subject to duties, taxes and processing fees, which has the potential to shift the landscape for companies that were able to thrive in this market.
As example, a good costing $50 once it got to the end customer was still only $50. With de minimis not in play, a $50 good could avoid fees that would almost double when you factor in the additional costs. What remains to be seen is how these increased costs are handled, but the most likely scenario is the end consumer absorbing the bulk of those costs. Typically, producing these low-cost goods in China comes with stiff competition and razor-thin margins, leaving manufacturers and shippers unable to absorb the increase.
Stay Up To dAte
Looking for a more frequent update? Subscribe to our newsletter and receive the top five logistics articles of the week every Friday morning by selecting “Weekly News Update” when you select your preferences.
Get Weekly News Updates in Your InboxTrinity Logistics, a leading third-party logistics (3PL) provider, is thrilled to share the company has received a silver medal sustainability rating by EcoVadis, a trusted global provider of business sustainability assessments. This recognition marks a major milestone for Trinity, reflecting progress from the bronze medal rating received in 2023, and places the company in the top 15 percent of all organizations assessed in the past year.
Over 1,000 enterprises rely on EcoVadis to assess and manage sustainability practices within their supply chain. EcoVadis evaluates sustainability practices across its four key areas of Environment, Labor and Human Rights, Ethics, and Sustainability Procurement. Trinity made impressive strides in each category, achieving an overall score improvement from 55 to an outstanding 74, placing them in the 94th percentile of all companies.
Key Category Improvements
- Environment: +10 points
- Labor and Human Rights: +20 points
- Ethics: +20 points
- Sustainable Procurement: +30 points
This growth was driven by initiatives such as setting a five-year goal commitment to reduce emissions with the company’s motor carrier relationships and sourcing sustainable materials for company promotional items.
“Trinity Logistics is pleased to report an improvement from a bronze to a silver medal rating following the most recent EcoVadis assessment,” said Kristin Deno, Operational Risk Analyst at Trinity. “The EcoVadis scorecard shows where we sit currently and highlights areas where we can expand our efforts on the path to sustainability. This annual assessment has been very beneficial to keeping track of our sustainability initiatives as a whole while also helping us find opportunities for improvement, as shown from our 2023 to 2024 rating change.”
As part of the recognition, EcoVadis will plant a tree in Trinity’s name through their partnership with One Tree Planted, further contributing to global reforestation efforts.
Sustainability has been a long cornerstone of Trinity’s operations. Since 2009, the company has been a proud partner in the American Chemistry Council’s Responsible Care® program, which involves staying committed to improving company performance through community awareness, security, distribution, and pollution prevention. Additionally, the company is an active participant in the Environmental Protection Agency’s (EPA) SmartWay Program, focused on reducing greenhouse gas emissions and air pollution caused by freight transportation.
“We are honored to receive the silver rating from EcoVadis, recognizing our commitment to sustainable business practices,” said Sarah Ruffcorn, President at Trinity Logistics. “We recognize the vital role we play in the supply chain and our Team works to continuously improve in the key sustainability categories each year.”
LEARN MORE ABOUT TRINITY DISCOVER TRINITY'S SERVICESAbout Trinity Logistics
Trinity Logistics is a Burris Logistics Company, offering People-Centric Freight Solutions®. Our mission is to deliver creative logistics solutions through a mix of human ingenuity and innovative technology, enriching the lives of those we serve.
For the past 45 years, we’ve been arranging freight for businesses of all sizes in truckload, less-than-truckload (LTL), warehousing, intermodal, drayage, expedited, international, and technology solutions.
We are currently recognized as a Top Freight Brokerage by Transport Topics, a Green Supply Chain Partner by Inbound Logistics, and a Top Company for Women to Work for in Transportation by Women in Trucking.
Trinity Logistics, a national third-party logistics provider (3PL), is proud to announce its 2024 Platinum Agents. This distinguished group of Independent Freight Agents is recognized for their outstanding brokerage achievements in 2024. Thirty-five Agent offices earned Platinum status, with 11 of those achieving the newly-recognized, elite Platinum Plus level. These remarkable recipients represent 16 states across the U.S. and Mexico, highlighting the diverse and far-reaching impact of Trinity’s Agent network.
The Platinum recognition celebrates Agent offices that achieve at least $500,000 in annual brokerage, while Platinum Plus status is awarded to those exceeding $1.5 million. Since the program’s inception in 2018, the Platinum awards have honored top-performing Agents for their dedication to delivering exceptional logistics solutions.
“To achieve Platinum status in any year is a testament to the successful businesses our Agents have built,” said Greg Massey, Senior Vice President of Agent Development. “Results like these don’t just happen – they require dedication, determination, and a true passion for the work. Trinity is incredibly proud of their achievements, many of which are repeat recognitions, and we look forward to celebrating with them in June.”
To recognize their accomplishments, Trinity is thrilled to reward its Platinum Agents with an all-expenses-paid getaway to Barbados. This exclusive trip offers the honorees and their guests a well-deserved opportunity to recharge in a relaxing environment, network with peers, and celebrate their shared success.
Trinity’s Agent Program has been a cornerstone of the company’s business model for 35 years, supporting Independent Freight Agents with tools, resources, and a collaborative network. The Platinum awards, now in their sixth year, symbolize the program’s commitment to fostering success and celebrating excellence.
LEARN MORE ABOUT TRINITY DISCOVER FREIGHT AGENT PROGRAMAbout Trinity Logistics
Trinity Logistics is a Burris Logistics Company, offering People-Centric Freight Solutions®. Our mission is to deliver creative logistics solutions through a mix of human ingenuity and innovative technology, enriching the lives of those we serve.
For the past 45 years, we’ve been arranging freight for businesses of all sizes in truckload, less-than-truckload (LTL), warehousing, intermodal, drayage, expedited, international, and technology solutions.
We are currently recognized as a Top Freight Brokerage by Transport Topics, a Green Supply Chain Partner by Inbound Logistics, and holds a silver sustainability rating by EcoVadis.
Trinity Logistics, a leading, nationwide third-party logistics provider (3PL), is thrilled to announce the appointment of Gabrielle Macy as its Vice President of Administrative Services.
Macy comes to Trinity Logistics with a well-rounded history of roles that made her an optimal choice for the position. She brings nearly 20 years of extensive experience in administrative leadership and organizational development. Her expertise in transforming administrative functions and driving organizational growth aligns perfectly with Trinity’s commitment to excellence and continuous improvement.
“Gabrielle’s broad and extensive background in various positions including her previous roles as Executive Vice President of Operations and Chief Operating Officer certainly made her stand out for the position,” said Doug Potvin, Chief Financial Officer at Trinity Logistics. “She also has significant knowledge of technology and how it should be implemented to improve efficiency and effectiveness. But what truly set Gabrielle apart from other candidates is her incredible personality and dedication to nurturing others, making her an ideal fit for Trinity’s People-Centric culture.”
In her new role, Gabrielle will oversee all aspects of Administrative Services, including Credit, Collections, Risk, Invoicing, Carrier Compliance, and Claims. Her commitment to fostering a positive and productive work environment will make her a notable addition to Trinity’s leadership.
“The logistics industry is ripe with opportunity to drive meaningful impact, particularly in today’s fast-paced and interconnected global economy,” said Macy. “I am honored to join Trinity, a company that not only delivers exceptional logistics solutions but does so by prioritizing relationships, empowering its people, and embracing innovation.”
Macy is eager to foster growth within Trinity by enabling teams to reach their fullest potential. By cultivating a culture of trust, engagement, and continuous improvement, she aims to inspire and support every Team Member to deliver their best work and achieve shared success.
“This is more than a career step for me; it’s an opportunity to be a part of something bigger – a company that aligns its actions with its values and sets a standard of excellence in the industry,” Macy added. “I look forward to contributing Trinity’s legacy and shaping its future as we deliver value to our partners, customers, and communities.”
Trinity looks forward to the insight and experience Macy will bring to its back-end business operations and dedication to offering exceptional service and experiences to our business partners.
LEARN MORE ABOUT TRINITY DISCOVER TRINITY'S SERVICES VIEW CAREERSAbout Trinity Logistics
Trinity Logistics is a Burris Logistics Company, offering People-Centric Freight Solutions®. Our mission is to deliver creative logistics solutions through a mix of human ingenuity and innovative technology, enriching the lives of those we serve.
For the past 45 years, we’ve been arranging freight for businesses of all sizes in truckload, less-than-truckload (LTL), warehousing, intermodal, drayage, expedited, international, and technology solutions.
We are currently recognized as a Top Freight Brokerage by Transport Topics, a Green Supply Chain Partner by Inbound Logistics, and holds a silver sustainability rating by EcoVadis.