
07/19/2024 by Greg Massey
July 2024 Freight Market Update
Stay up to date on the latest information on conditions impacting the freight market, curated by Trinity Logistics through our Freightwaves Sonar subscription.
UP AND TO THE RIGHT
For the past year, the general direction of the Outbound Tender Volume Index (OTVI) has been on an upward trajectory as seen in Figure 1.1.
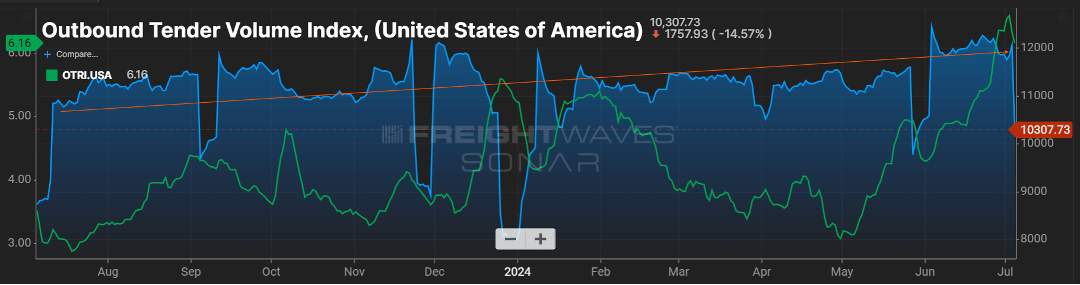
While it is not approaching the levels seen in 2021, the volume index is quickly approaching levels seen in 2022. This has buoyed optimism in the industry.
Another rise we’re keeping an eye on is the Outbound Tender Rejection Index, the rate at which carriers are saying “no” to freight where they have paper rates with a shipper. A six percent rejection rate may not sound important, but considering the rejection rate has stagnated in the three-to-four percent range for the past year plus, it’s another sign that the freight pendulum may be nearing more of a balanced market.
In 2021, rejection rates hovered in the 20-30 percent range. This was more a product of increased freight volumes and carriers realizing they could get higher rates in the spot market versus the contracted rates they had in place. The uptick in rejection now appears to be more of a limit of capacity in certain markets versus carriers hedging their bets on the open load board.
Drip, Drip, Drip
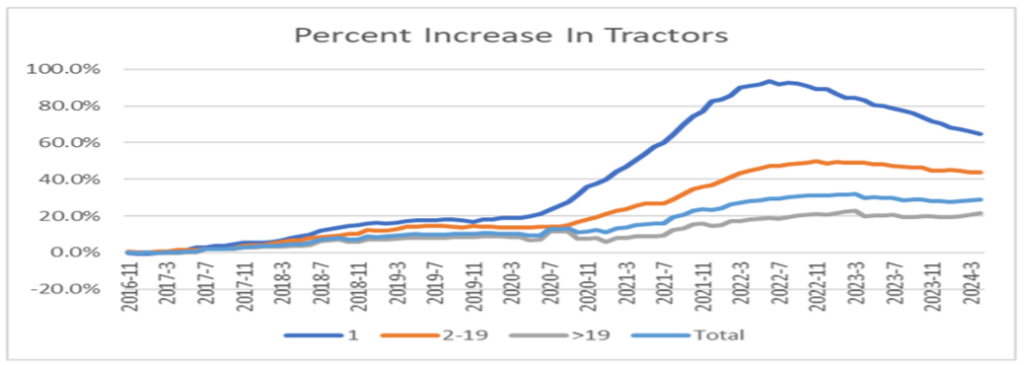
Speaking of that capacity, there is a reduction happening, albeit a slow drip. As shown in Figure 1.2, for the past year and a half, almost two years, the biggest reduction in capacity has been from the owner-operator segment. Most likely, the carriers in this group that have exited the market are those that rushed in when freight and rates were plentiful, and now are finding more normalized rates combined with high overhead to be unsustainable.
As shippers continue to look ahead, not having reliability among this segment of carriers could prove problematic as volumes escalate and more freight flows to the spot market, which is supported heavily by owner-operator drivers. This is a good reason for shippers to ensure they have a good mix of carrier and broker partners.
Baltimore Still Recovering
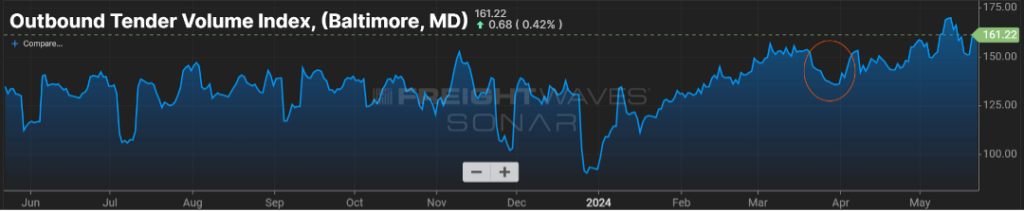
Finally, it has been just over three months since the bridge collapsed near Baltimore, MD. The waterways in the surrounding area appear to be returning to normal, and the need for traffic that populated the bridge to divert to alternate routes seems to be no worse for the wear on drivers.
Looking at volume in that market in Figure 1.3 since the end of March when the event occurred, after a slight dip when freight had to be re-routed, volumes as measured by the OTVI have increased just over 10 percent. Certainly, there is still work to be done, short- and long-term, but the Baltimore area appears to have powered through an unfortunate event.
Stay Up To dAte
Looking for a more frequent update? Subscribe to our newsletter and receive the top five logistics articles of the week every Friday morning by selecting “Weekly News Update” when you select your preferences.
Get Weekly News Updates in Your Inbox