
09/16/2025 by Greg Massey
September 2025 Freight Market Update
Stay up to date on the latest information on conditions impacting the freight market, curated by Trinity Logistics through our Freightwaves Sonar subscription.
SLUGGISH IS THE STATUS QUO IN FREIGHT
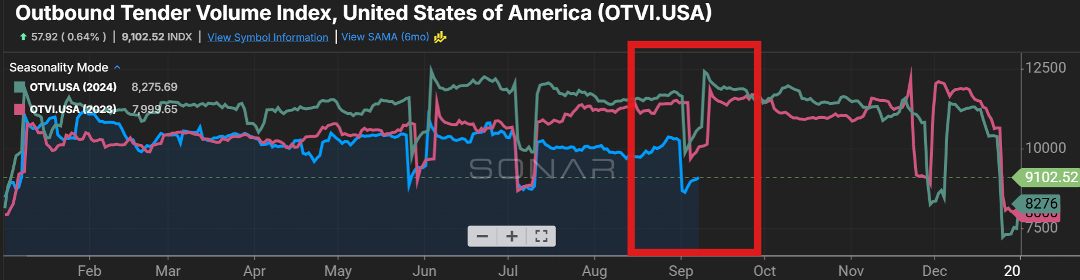
Stagnation continues to plague the over-the-road freight market. After a promising start to 2025, with freight volumes showing growth compared to last year, the trend has been ho-hum for the past six month, with the last few showing volumes below ’23 and ’24 volumes (Figure 1.1).
Slowing import activity over the past two months has certainly contributed, with import volumes descending whereas the past few years has seen moderate growth during the summer months. One could point to ocean shipments from China being a big reason for the decline, with import volume down 19 percent year-over-year (YoY).
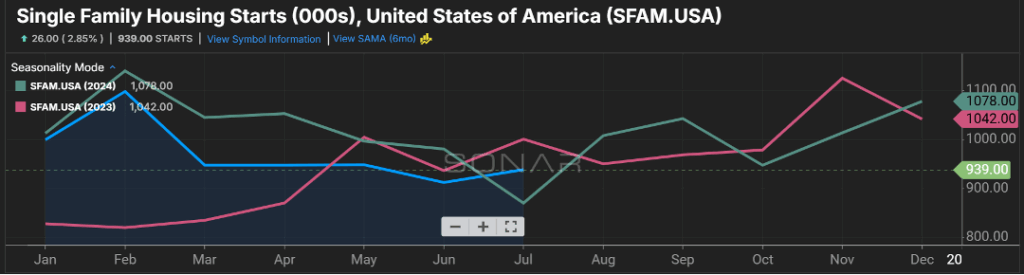
Additionally, a decline in YoY housing starts (Figure 1.2) is also a contributor. While many think of the initial over-the-road volume created when a house in built, just as important is the secondary volume that comes with new home owners purchasing furniture, appliances, and housing accessories to fill their beautiful new abode. On average, each new home built contributes seven truckloads of freight.
STEADY RATES TO CONTINUE
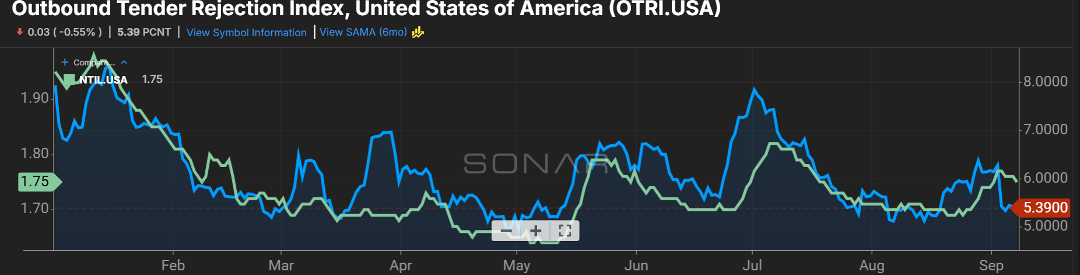
The stagnation in freight has kept tender rejections low in 2025, trending in the five to 6 percent range recently (Figure 2.1). The lack of freight volume combined with carriers saying “yes” to freight tendered their way the majority of the time has leveled carrier rates over the last several months, hovering between $1.70 and $1.80 per mile. Based on historical trends, expect the steady rates to continue as we close out the year.
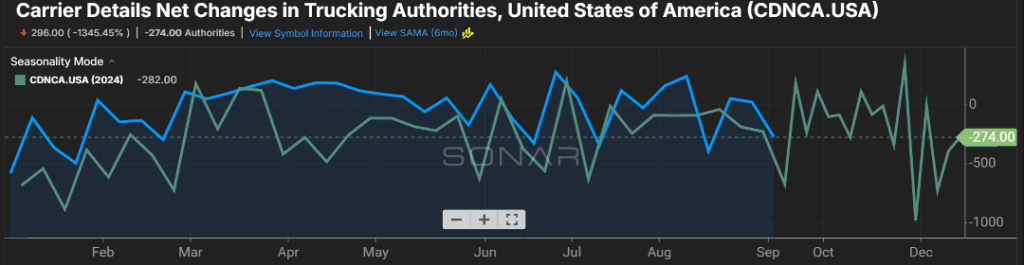
And while there are carriers exiting the market, there are also new carrier authorities entering (Figure 3.1). It will be interesting to see the impact on the mandate from the government enforcing the English language proficiency, particularly will the threat of losing federal funding be enough to prompt states lack in enforcement to start pulling drivers off the roads that fail. Loss of capacity is most likely the driver in significant movement for carrier rates.
Stay Up To dAte
Looking for a more frequent update? Subscribe to our newsletter and receive the top five logistics articles of the week every Friday morning by selecting “Weekly News Update” when you select your preferences.
Get Weekly News Updates in Your Inbox