
10/20/2025 by Greg Massey
October 2025 Freight Market Update
Stay up to date on the latest information on conditions impacting the freight market, curated by Trinity Logistics through our Freightwaves Sonar subscription.
Capacity Could Face Its Next Test
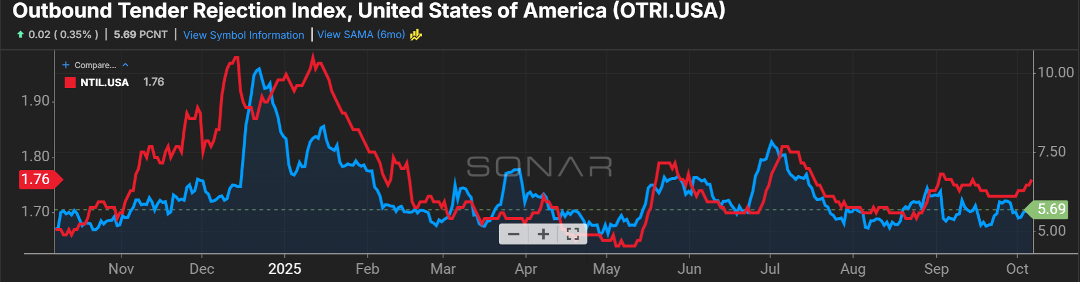
I am not sure if the right amount of attention was paid to the recent announcement by Secretary Duffy at the end of last month around non-domiciled CDL’s. It’s anticipated that this will have a larger impact on the owner-operator and small fleet community, more than the larger fleets. Non-domiciled CDL drivers tend to sustain on a lower-than-average cost of living, making it palatable for carriers to accept at or below-market pricing for hauling shipments. This has the potential to push rejection rates and carrier rates higher as we close out 2025 and head into 2026, as it’s anticipated that over 100,000 drivers could be impacted.
While the impact of current drivers will not be immediately felt, since there is a two-year grace period, it will certainly restrict any new drivers looking to enter the over-the-road market. One of the best measurements of this will be seen in the tender rejection rate and national truckload rate index as seen in Figure 1.1. A driver loss of this size will certainly bring the use of autonomous trucks back into the conversation.
No Holiday Bump in Sight
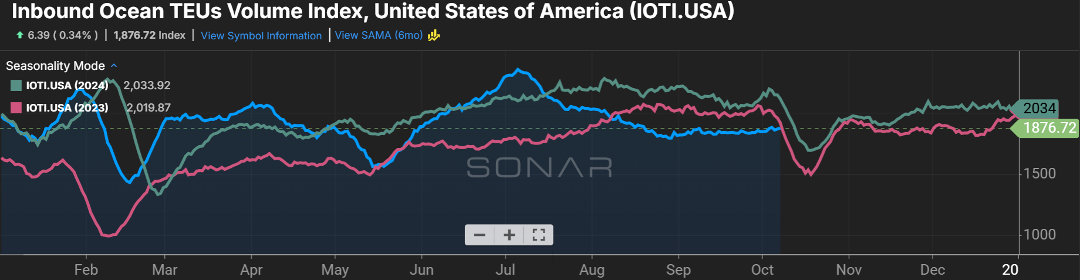
For those keeping an eye on inbound ocean volumes, don’t expect a surge any time soon, certainly not before the close of 2025. Import volumes continue to trend below the last few years (Figure 2.1), and the flatline will likely dip slightly in the next several weeks before steadying as we head into 2026. Even a push in holiday consumer spending is not likely to dent depressed volumes at our major U.S. ports.
Stay Up To dAte
Looking for a more frequent update? Subscribe to our newsletter and receive the top five logistics articles of the week every Friday morning by selecting “Weekly News Update” when you select your preferences.
Get Weekly News Updates in Your Inbox