11/15/2024 by Greg Massey
November 2024 Freight Market Update
Stay up to date on the latest information on conditions impacting the freight market, curated by Trinity Logistics through our Freightwaves Sonar subscription.
What to Expect in the Short-Term
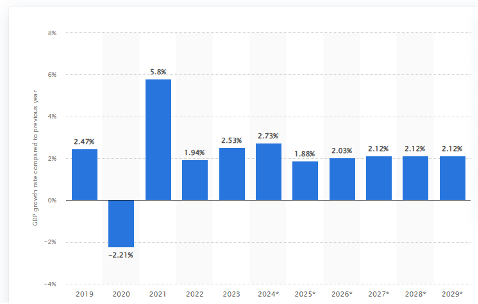
Well, so much for a recession. The U.S. is anticipating year-over-year growth of 2.8 percent in 2024 with regards to gross domestic product (GDP). That percentage of growth appears to be trending less in calendar 2025, with moderate growth forecast through the end of 2029 (Figure 1.1).
Generally, for every one percent of GDP growth, that typically translates into 1.5 percent growth in over-the-road truckload volume. Based on those projections, we expect freight volumes to climb by four to five percent in the coming year.

Conditions are also turning more favorable for a pendulum swing to the side of the carriers. Two reasons for the bullish outlook – dwindling capacity and tariffs (be it threat or real), simple supply and demand.
INCHING CLOSER TO BALANCE
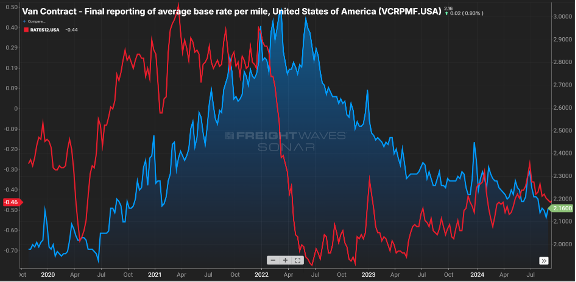
On the capacity side, the spread between contract and spot rates, which was near $0.80 per mile in the middle of 2022, has now fallen below $0.50 per mile. Keep in mind contract is almost always above spot sans latter 2020 and early 2021.
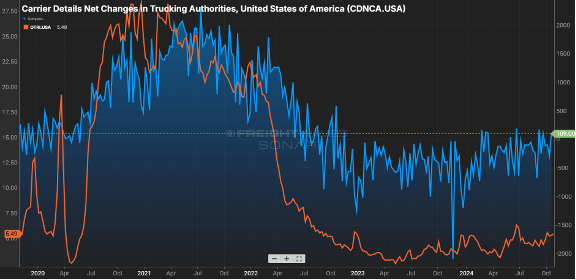
The gap has closed primarily due to contract rates receding, from the $2.30 range in early ’24 to now being $0.15 less, as illustrated by. Figure 2.. Figure 2.2 shows the net change in for-hire carriers versus the tender rejection rate. Since mid-2022, carriers have started to shun the market as higher costs to operate & lower rates made sustainability a challenge.
Where does shrinking capacity first show up? In the tender rejection rates. Carriers will say no to a guaranteed rate load either because they have no equipment in the area or there is a more favorable paying load available.
Rejection rates cresting the five percent mark may not sound significant, but keep in mind rejection rates were in the two to three percent range as we started this calendar year. Eight to 10 percent is a more balanced market, and we are close to that. Usually, rejection rates in double digits signify more pricing leverage is held by the carrier community.


The other driving factor is around demand. While there are some sectors showing slight gains, the November election could be the spark that drives a glut of freight movement.
With Republicans poised to control the White House and Congress, impending tariffs will drive a flurry of activity as shippers look to move goods prior to an imposed increase in cost, This is likely a short-term surge as “too much inventory” is a real thing, and once tariffs are imposed, consumers ultimately will feel the brunt of increased costs and could hamper purchasing. However, the next pivot point will be around movement of production to domestic U.S. or near-shore locations.
After a blah few years, things are about to get interesting.
Stay Up To dAte
Looking for a more frequent update? Subscribe to our newsletter and receive the top five logistics articles of the week every Friday morning by selecting “Weekly News Update” when you select your preferences.
Get Weekly News Updates in Your Inbox
