08/15/2024 by Greg Massey
August 2024 Freight Market Update
Stay up to date on the latest information on conditions impacting the freight market, curated by Trinity Logistics through our Freightwaves Sonar subscription.
GOOD NEWS, BUT…
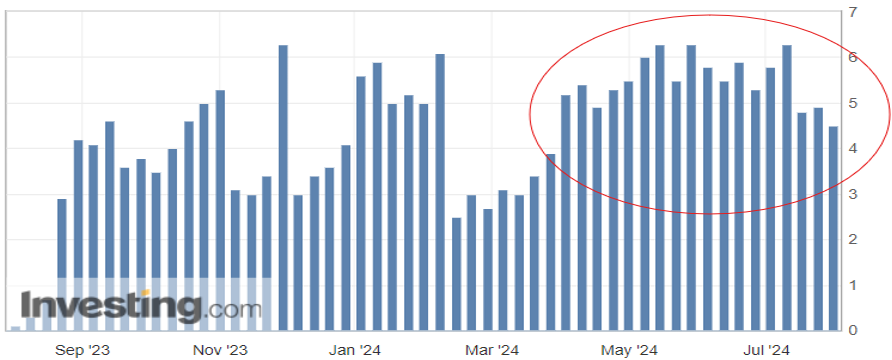
Consumer spending is the biggest driver of the U.S. economy, accounting for roughly two-thirds of the nation’s Gross Domestic Product (GDP). One measurement of that consumer spending is the Redbook index, which compares year-over-year growth for large domestic general retailers (think Walmart, Amazon, Target). The index has averaged just over 3.5 percent for the past 20 years, so the recent year-over-year (YoY) growth in the four-plus percent range speaks to the strength of consumer spending (Figure 1.1). This index alone certainly gives reason for optimism, however there is a cautionary tale with regards to consumer debt.
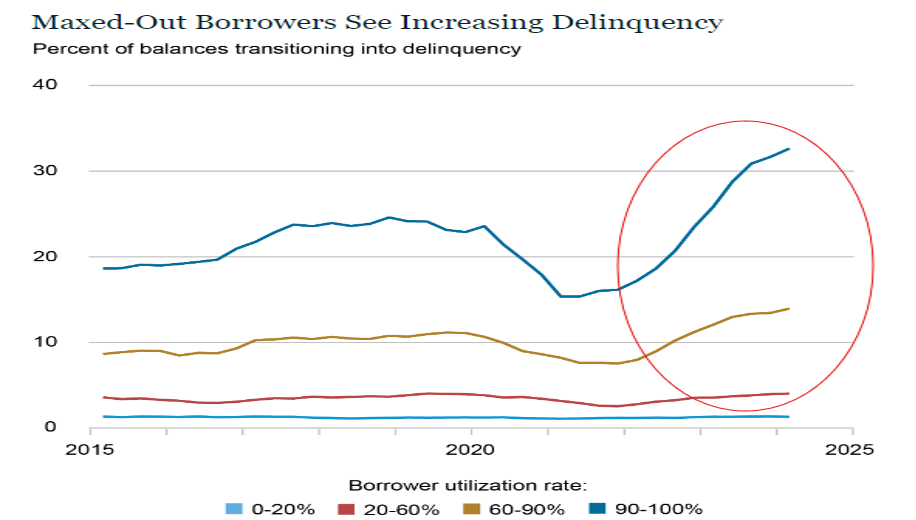
After years of next to zero interest rates to keep the economy on its legs, consumers have seen interest rates on the rise, with the federal funds rate at its highest level since the early 2000’s. With the increase in interest to borrow funds, combined with the increased costs of essentials (food, housing, energy), many households have turned to credit cards to fill the gap for funding of these necessities. Figure 1.2 from the New York Fed Consumer Credit Panel shows the rise in consumer delinquency particularly in those groups that utilize more than half of their available credit line.
While there appears to be relief on the horizon with the impending reduction in interest rates, it appears a portion of active consumers may be pulling back on purchases for those items that are not mission critical. This, in turn, will have an impact on restocking of inventories and trucking activity.
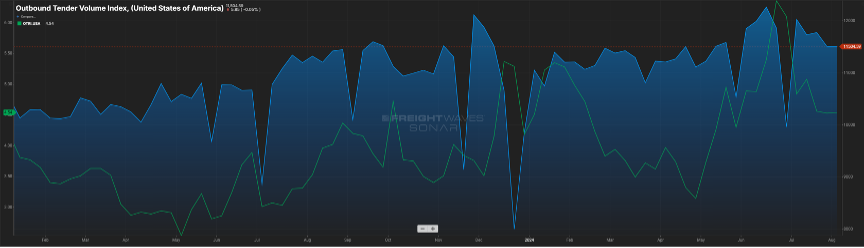
While it is not approaching the levels seen in 2021, the volume index is quickly approaching levels seen in 2022. This has buoyed optimism in the industry.
JUST SOME GOOD LUCK? TIME WILL TELL
The uptick in consumer spending, restocking of inventories and the threat of labor strife in the fourth quarter of this year has been to the benefit of those involved with the rail and import business.
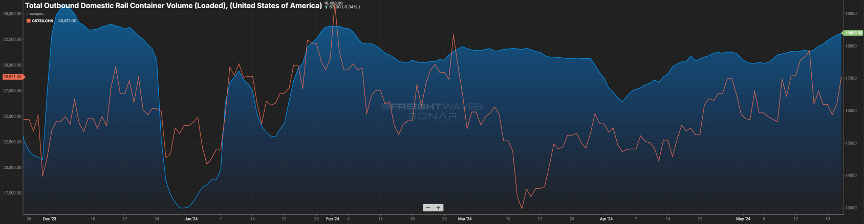
In Figure 2.1 below, the blue line represents loaded container rail volume in the U.S. and the past three months have seen the volume grow. Similarly, container volumes to the U.S. have been on the rise.
The orange line represents container volume from China over the past six months. While some of that traditional volume is now flowing through other countries, like Mexico, there is still a great deal of activity with U.S.-China trade. Will this continue or is it fool’s gold? That is something we will continue to keep an eye on as a pullback in consumer spending will dictate how the needle moves.
STAYING RIGHT WHERE WE ARE
Finally, looking at domestic over-the-road volume (blue line) compared with carrier rejection rates (green line). The slight upward trend continues with volumes and rejection rates (Figure 3.1). Rejection rates continue to inch towards 2022 levels, but a five-to-six rejection rate is about half of what one would see in a balanced freight market.
This has yet to manifest itself in the way of increased freight rates, as capacity still exists in the market.Shippers and carriers should anticipate little change in conditions (although hurricane season is looming) until early 2025.
Stay Up To dAte
Looking for a more frequent update? Subscribe to our newsletter and receive the top five logistics articles of the week every Friday morning by selecting “Weekly News Update” when you select your preferences.
Get Weekly News Updates in Your Inbox