

08/17/2026 by Amanda Lloyd
August 2026 Freight Market Update: Finding Its Footing
The freight market continues to evolve as we move through the second half of 2026.
After significant movement during the first half of the year, several transportation indicators have started to moderate. Tender rejection rates have come down from early-summer highs, freight volumes have softened, and spot pricing has pulled back from its July peak.
But moderation does not mean a return to the softer freight market of recent years.
Tender rejections remain elevated compared with much of 2024 and 2025. Contract rates are near their one-year highs, diesel prices remain significantly higher year over year, and the broader logistics market continues to expand.
The August 2026 freight market story is becoming clearer: the market has cooled from its summer highs but remains firmer than it was a year ago.
60 Second Freight Market Pulse
If you only have a minute, here’s this month’s freight snapshot:
- Tender rejections are at 13.27%, down from early-summer highs near 17% to 18%, but still well above much of the past two years.
- Tender volumes have moderated, with OTVI at approximately 10,096 after reaching higher levels earlier this summer.
- Truckload spot pricing has pulled back to $3.35, while van contract rates remain near their one-year high at approximately $2.72 per mile.
- The Logistics Managers’ Index registered 68.9 in July, down from 71.1 in June but still signaling expansion.
- U.S. on-highway diesel averaged $5.257 per gallon as of August 10, $1.503 higher than the same period last year.
The takeaway: The market has cooled from its early-summer highs, but cooling does not mean a return to the softer conditions of the previous freight cycle.
Capacity Pressure Eases, but Remains Elevated
Carrier tender rejections have been one of the clearest signs of the freight market’s shift over the past year.
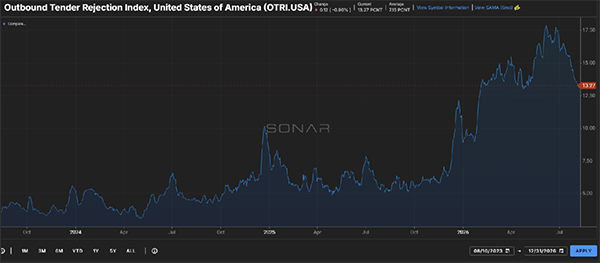
The national Outbound Tender Rejection Index (OTRI) currently sits at 13.27%, down from the 17% to 18% levels reached earlier this summer (Figure 1.1).
Source: FreightWaves SONAR
OTRI measures the percentage of contracted loads that carriers reject. Higher rejection rates can signal tighter available capacity and greater choice in which loads they accept.
The three-year view adds important context. While rejection rates have moved lower in recent weeks, they remain well above the levels seen throughout most of 2024 and 2025.
The distinction matters: easing capacity pressure is not the same as loose capacity.
Freight Demand Has Moderated
Freight demand is showing a different pattern.
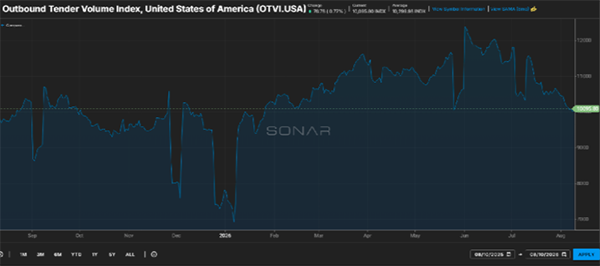
The Outbound Tender Volume Index (OTVI) currently sits at approximately 10,096, following higher levels throughout the spring and early summer (Figure 2.1).
Source: FreightWaves SONAR
After moving above 12,000 in June, tender volumes gradually declined through July and into August.
Looking at demand and capacity together provides a more complete picture. Lower tender volumes and declining rejection rates suggest some of the immediate market pressure has eased.
However, rejection rates remain well above where they were a year ago, even as demand has moderated.
This tells us demand alone does not explain the current market shift.
Transportation Pricing Shows Two Different Timelines
Spot and contract pricing are telling different parts of the same market story.
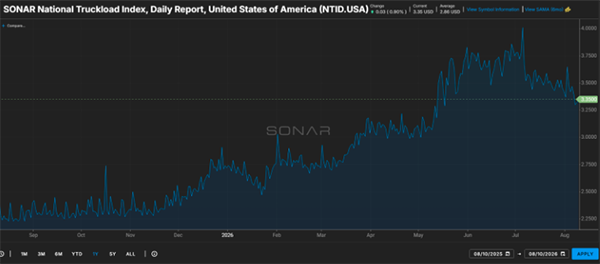
The SONAR National Truckload Index Daily Report (NTID) climbed from the low-$2.00 range per mile last fall to nearly $4.00 at its early-July peak. It has since moderated to approximately $3.35 (Figure 3.1).
Source: FreightWaves SONAR
Van contract rates have moved differently. They have steadily increased throughout 2026 and currently sit near their one-year high at approximately $2.72 per mile (Figure 4.1).
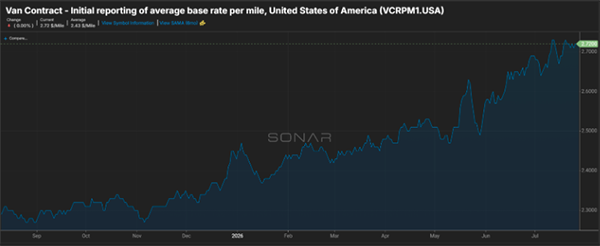
Spot pricing tends to respond more quickly to changes in freight demand and available capacity. Contract pricing generally moves more slowly.
Looking at both shows two different timelines within the same pricing environment.
Spot pricing has eased from its summer peak, while contract pricing continues to reflect the firmer conditions that developed during the first half of 2026.
The Broader Logistics Market Remains in Expansion
The Logistics Managers’ Index (LMI) provides a broader look at transportation, inventory, and warehousing activity.
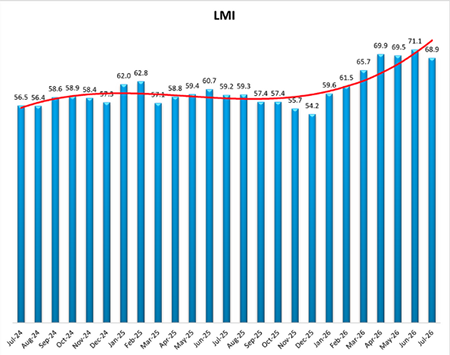
The overall LMI registered 68.9 in July, down from 71.1 in June (Figure 5.1). A reading above 50 indicates expansion.
Source: Logistics Managers’ Index
July’s decline represents slower growth, not contraction. For context, the index stood at 54.2 in December 2025 before rising throughout the first half of 2026.
This follows the same pattern we see across several indicators this month: momentum has cooled from recent highs, while overall logistics activity remains elevated.
Diesel Adds Another Layer to the Market
Fuel remains a significant part of the transportation cost environment, although the latest data shows some relief from recent highs.
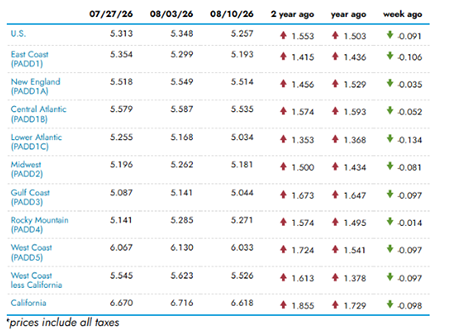
According to the U.S. Energy Information Administration, the national average price for on-highway diesel was $5.257 per gallon as of August 10, down $0.091 from the previous week. Despite the weekly decline, diesel remains $1.503 per gallon higher than the same period last year. (Figure 6.1).
Source: U.S. Energy Information Administration
The latest decline was broad-based, with diesel prices falling week over week across every region. Regional averages now range from $5.034 per gallon in the Lower Atlantic to $6.033 on the West Coast, while California remains the highest at $6.618 per gallon.
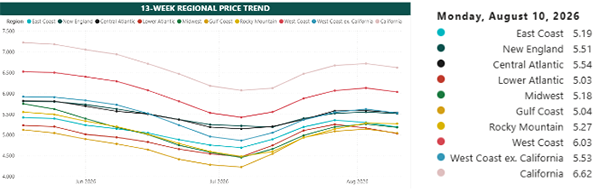
The 13-week trend provides additional context. Diesel prices fell through the spring before rising sharply during the summer. While prices have started to ease again, they remain elevated compared with levels seen earlier this year. (Figure 7.1).
Source: U.S. Energy Information Administration
The broader picture is mixed: some immediate fuel pressure has eased, but diesel remains a much larger transportation cost factor than it was a year ago.
What This Means for Freight Planning
The current market shows why it is important to look at several freight indicators together rather than rely on a single national trend.
The indicators are not moving in the same direction or at the same pace. That can create very different conditions depending on lane, region, equipment type, mode, and freight characteristics.
National trends provide an important benchmark, but they may not fully reflect what is happening within an individual freight network.
As the market moves toward fall, visibility into freight patterns, capacity conditions, and transportation costs will remain important in understanding how the market continues to develop.
Where the Market Goes from Here
The freight market rarely moves in a straight line, and this summer has been a good example. After a period of rapid change, recent data points to a more measured pace as we move into the second half of the year.
What stands out is how differently the pieces of the market are moving. Demand, capacity, pricing, and fuel are not following the same path or changing at the same speed. Together, those differences create a freight market that has no single national indicator can fully explain.
As we move toward the fall shipping season, the focus shifts from how quickly conditions changed earlier this year to where they settle next. The upcoming months should provide a clearer view of how seasonal demand, available capacity, pricing, and broader supply chain activity shape the next stage of the freight cycle.
What We’re Watching Next Month
- Carrier Capacity: Tender rejection trends as the market moves further away from the early-summer peak.
- Freight Demand: Signs of stabilization in tender volumes following the moderation seen throughout July and early August.
- Transportation Pricing: The relationship between spot rates, which have pulled back from recent highs, and contract rates that remain near the top of their one-year range.
- Fuel: The direction of diesel prices following the recent pullback, with the national average remaining above $5 per gallon.
- Broader Logistics Activity: The pace of expansion across the LMI following July’s moderation from the June high.
- Regional and Modal Conditions: Where national trends differ from what is happening within individual regions, equipment types, and transportation modes.
Don’t Let Market Shifts catch you off guard
Freight conditions can shift quickly and have a major impact on your transportation strategy. Subscribe to receive our monthly Freight Market Update in your inbox and also have the option to receive our Weekly News update for a quick Friday morning snapshot of what’s shaping the market.
Don't Miss the Next One – Sign UpLooking for a more reliable transportation strategy? Request a free quote for your next shipment and see how Trinity helps shippers stay flexible in changing market conditions.
Quote Your Next Shipment With TrinityMarket data sourced from FreightWaves SONAR, the Logistics Managers’ Index, and the U.S. Energy Information Administration. Market conditions and index values reflect the latest available data at the time of publication and are subject to change.