Stay up to date on the latest information on conditions impacting the freight market, curated by Trinity Logistics through our Freightwaves Sonar subscription.
Rising Tide of Rejection
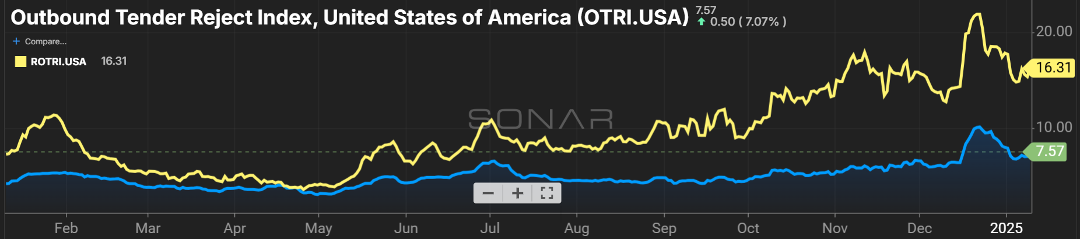
Continuing our theme of tender rejection rates being a leading indicator of freight rates, the momentum gained over the last few months continues.
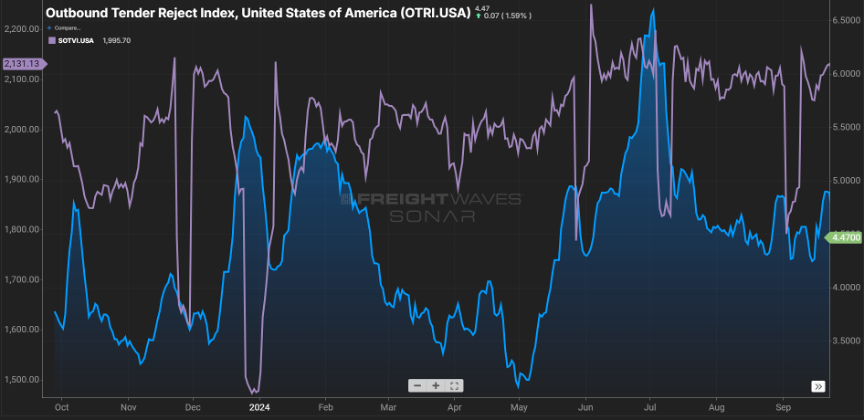
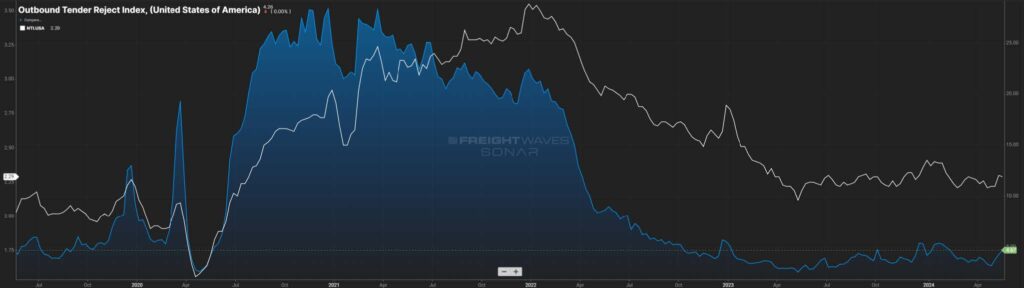
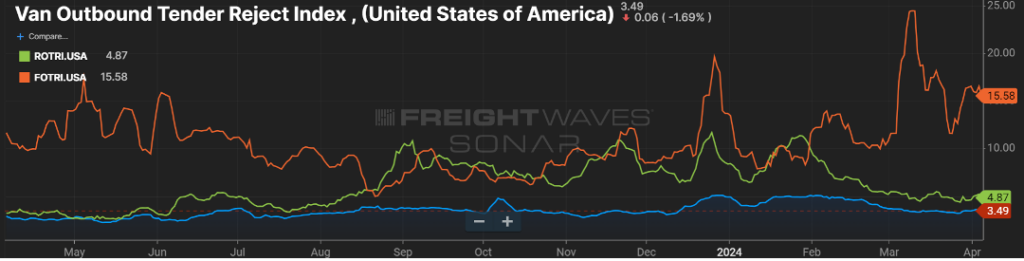
While the tender rejection rate (Figure 1.1) for the overall U.S. (blue line) briefly touched the 10 percent marker, it has retreated. However, it still appears to be slowly climbing, currently sitting just below eight percent. Being 300 basis points above the mark a year ago is a big deal and shows the relationship that exists between carriers saying “no thank you” to a shipment offered to them and the continuing retreat in carrier capacity.
Further, the rejection rate on refrigerated shipments (yellow line) has continued its run of outpacing the overall U.S. rejection rate for the past eight months. Colder than normal temperatures across much of the country has contributed to the need for reefer unit trailers to keep product from freezing. Shippers, especially those that play in refrigerated commodities, need to ensure they are flush with carrier and broker capacity, and should anticipate rate increase requests from their providers.
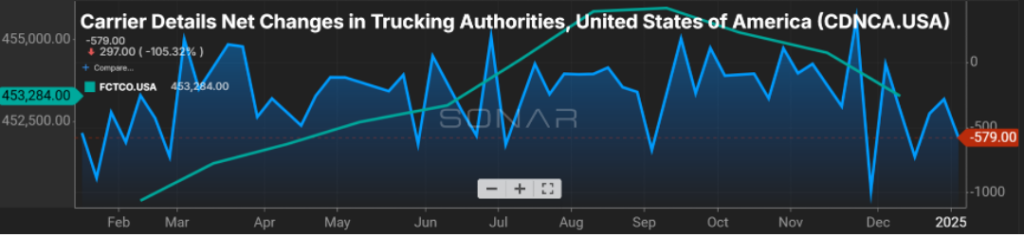
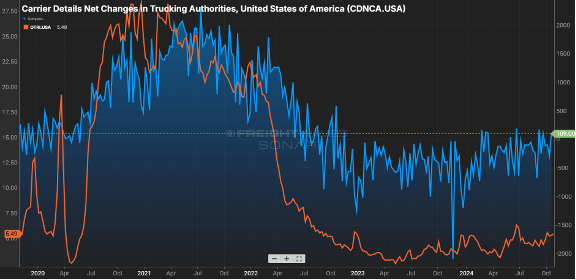
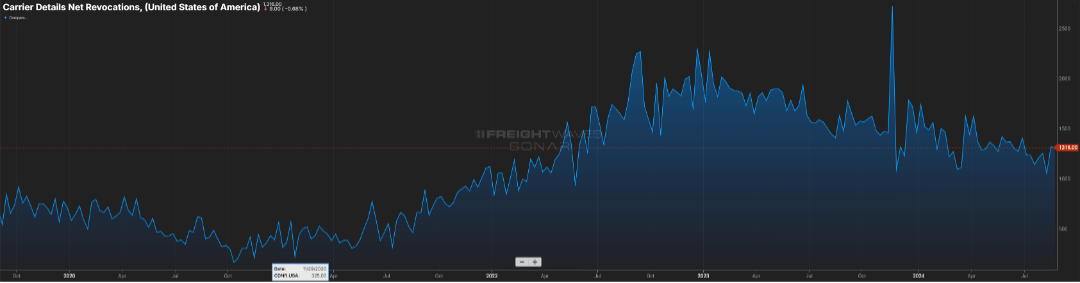
Speaking of capacity, we continue to see the slow trickle of carriers leaving the market. Looking at the past year, the trend for 2025 is we will see capacity decline at a three-to-five percent pace. Figure 2.1 shows the net change in carrier authorities, for the most part staying in the negative territory.
Looking further into the loss of capacity, the teal line shows the change in authority for micro fleets (one-to-five trucks). This is typically the owner operator community. Increases in costs to operate, as well as equipment where these carriers may be upside down on payments, has caused several to retreat from operating in the industry.
Calm Waters Ahead
Finally, a potential strike at East Coast and Gulf ports was averted for a second time. This is certainly good news as shippers continue to pull forward orders in anticipation of tariffs being imposed on import volume.
Just a few years ago, East Coast ports were seeing almost half of the U.S. import volume flow through their ports. Much of this shift was due to labor and operations issues on the West Coast. We are now seeing that reverse course.
East Coast ports are handling 41 percent of inbound ocean freight, while West Coast ports are up over the same two-year period, from 37 percent to 47 percent. With ILWU voting in favor of a contract that extends through mid-2028, and East and Gulf port workers agreeing on a six-year deal, a sense of calm should come to shippers and manufacturers that depend on our ports to receive their freight.
Stay Up To dAte
Looking for a more frequent update? Subscribe to our newsletter and receive the top five logistics articles of the week every Friday morning by selecting “Weekly News Update” when you select your preferences.
Get Weekly News Updates in Your InboxStay up to date on the latest information on conditions impacting the freight market, curated by Trinity Logistics through our Freightwaves Sonar subscription.
CANARY IN THE CAVE
Data is everywhere, both on a macro and micro level. How this data is interpreted and reported, and the contradictions it can create, has the potential to leave one wondering just what to believe.
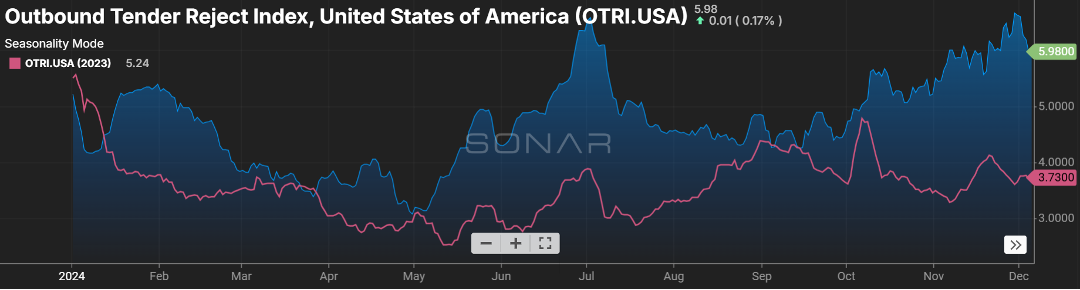
For years now, I have been, pretty much daily, watching like a hawk the ebb and flow of tender rejections (Figure 1.1). While this is focused on the contact freight market, what happens on the contract side absolutely has an impact on the spot market side. The last year plus has been pretty vanilla, with rejection rates almost negligible.
This pales in comparison to just a few years ago when carriers said “no” to shipments 30-plus percent of the time. While the current six percent rejection rate won’t set off many alarms, it is noteworthy in its trend. Heck, just six months ago, the rejection rate was hovering below three percent. Yes, there is seasonality that plays into the rejection rate, but seasonality also existed in 2023, and the rejection rate lagged during the fourth quarter of the year. While there will be some dips along the way over the next six months, I expect the upward trend to continue.
LOOMING STRIKES & DISRUPTION
Many in the industry breathed a sigh of relief when the short-lived port strikes on the East and Gulf Coasts were settled. However, while there was agreement on several issues, the automation at the ports loop remained open.
We are fast approaching the 90-day period for resolve in January, and the threat of another shutdown looms. Combined, the East and Gulf Coast ports provide service for incoming and outgoing ocean containers for more than half of the volume in the U.S.
So, what should you be prepared for if a second strike were to happen?
👉 Like it or not, we are dependent on unfinished and finished goods from overseas. Not being able to receive those goods will cause shortages on things like groceries, electronics, and clothing to name a few.
👉 The U.S. economy’s dependence on consistent flow of goods in and out of our country is to the tune of about four billion dollars per day. Even a week-long strike has the potential to severely delay the flow of goods around the ports for a month-plus.
👉 While most U.S. businesses would feel the effects, small businesses would be the most impacted as their already thin profit margins would be challenged by increased costs for goods along with a tight labor market and inflation.
👉 It’s not just consumer-ready goods. The ports play a role in the preparedness for emergency situations and defense posture.
We are already seeing the surge in import volume, up about eight percent versus a year ago as shippers look to get ahead of potential tariffs and now a labor shortage. Couple this with a downward trend in over-the-road capacity (Figure 2.1), and you have a recipe to further accelerate trucking rates.
U.S. shippers need to be reviewing their carrier and broker partners for compliance in the coming months. While many have not had the need recently, they should consider adding extra companies to their routing guides.
Stay Up To dAte
Looking for a more frequent update? Subscribe to our newsletter and receive the top five logistics articles of the week every Friday morning by selecting “Weekly News Update” when you select your preferences.
Get Weekly News Updates in Your InboxStay up to date on the latest information on conditions impacting the freight market, curated by Trinity Logistics through our Freightwaves Sonar subscription.
What to Expect in the Short-Term
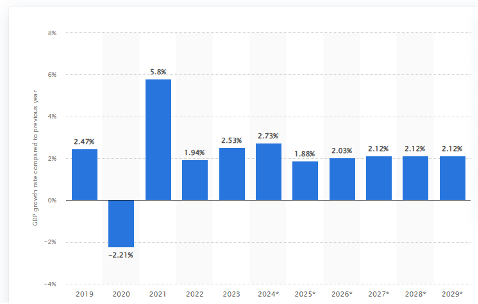
Well, so much for a recession. The U.S. is anticipating year-over-year growth of 2.8 percent in 2024 with regards to gross domestic product (GDP). That percentage of growth appears to be trending less in calendar 2025, with moderate growth forecast through the end of 2029 (Figure 1.1).
Generally, for every one percent of GDP growth, that typically translates into 1.5 percent growth in over-the-road truckload volume. Based on those projections, we expect freight volumes to climb by four to five percent in the coming year.
Conditions are also turning more favorable for a pendulum swing to the side of the carriers. Two reasons for the bullish outlook – dwindling capacity and tariffs (be it threat or real), simple supply and demand.
INCHING CLOSER TO BALANCE
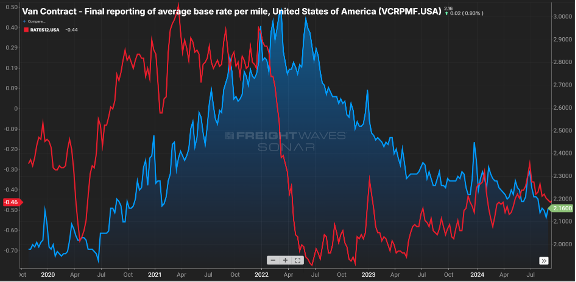
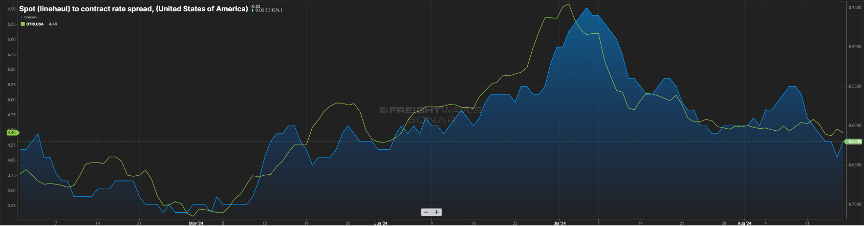
On the capacity side, the spread between contract and spot rates, which was near $0.80 per mile in the middle of 2022, has now fallen below $0.50 per mile. Keep in mind contract is almost always above spot sans latter 2020 and early 2021.
The gap has closed primarily due to contract rates receding, from the $2.30 range in early ’24 to now being $0.15 less, as illustrated by. Figure 2.. Figure 2.2 shows the net change in for-hire carriers versus the tender rejection rate. Since mid-2022, carriers have started to shun the market as higher costs to operate & lower rates made sustainability a challenge.
Where does shrinking capacity first show up? In the tender rejection rates. Carriers will say no to a guaranteed rate load either because they have no equipment in the area or there is a more favorable paying load available.
Rejection rates cresting the five percent mark may not sound significant, but keep in mind rejection rates were in the two to three percent range as we started this calendar year. Eight to 10 percent is a more balanced market, and we are close to that. Usually, rejection rates in double digits signify more pricing leverage is held by the carrier community.
The other driving factor is around demand. While there are some sectors showing slight gains, the November election could be the spark that drives a glut of freight movement.
With Republicans poised to control the White House and Congress, impending tariffs will drive a flurry of activity as shippers look to move goods prior to an imposed increase in cost, This is likely a short-term surge as “too much inventory” is a real thing, and once tariffs are imposed, consumers ultimately will feel the brunt of increased costs and could hamper purchasing. However, the next pivot point will be around movement of production to domestic U.S. or near-shore locations.
After a blah few years, things are about to get interesting.
Stay Up To dAte
Looking for a more frequent update? Subscribe to our newsletter and receive the top five logistics articles of the week every Friday morning by selecting “Weekly News Update” when you select your preferences.
Get Weekly News Updates in Your InboxStay up to date on the latest information on conditions impacting the freight market, curated by Trinity Logistics through our Freightwaves Sonar subscription.
Feels like 2022
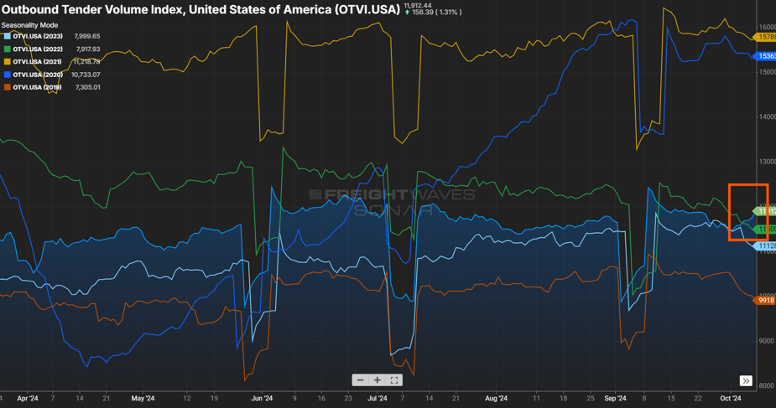
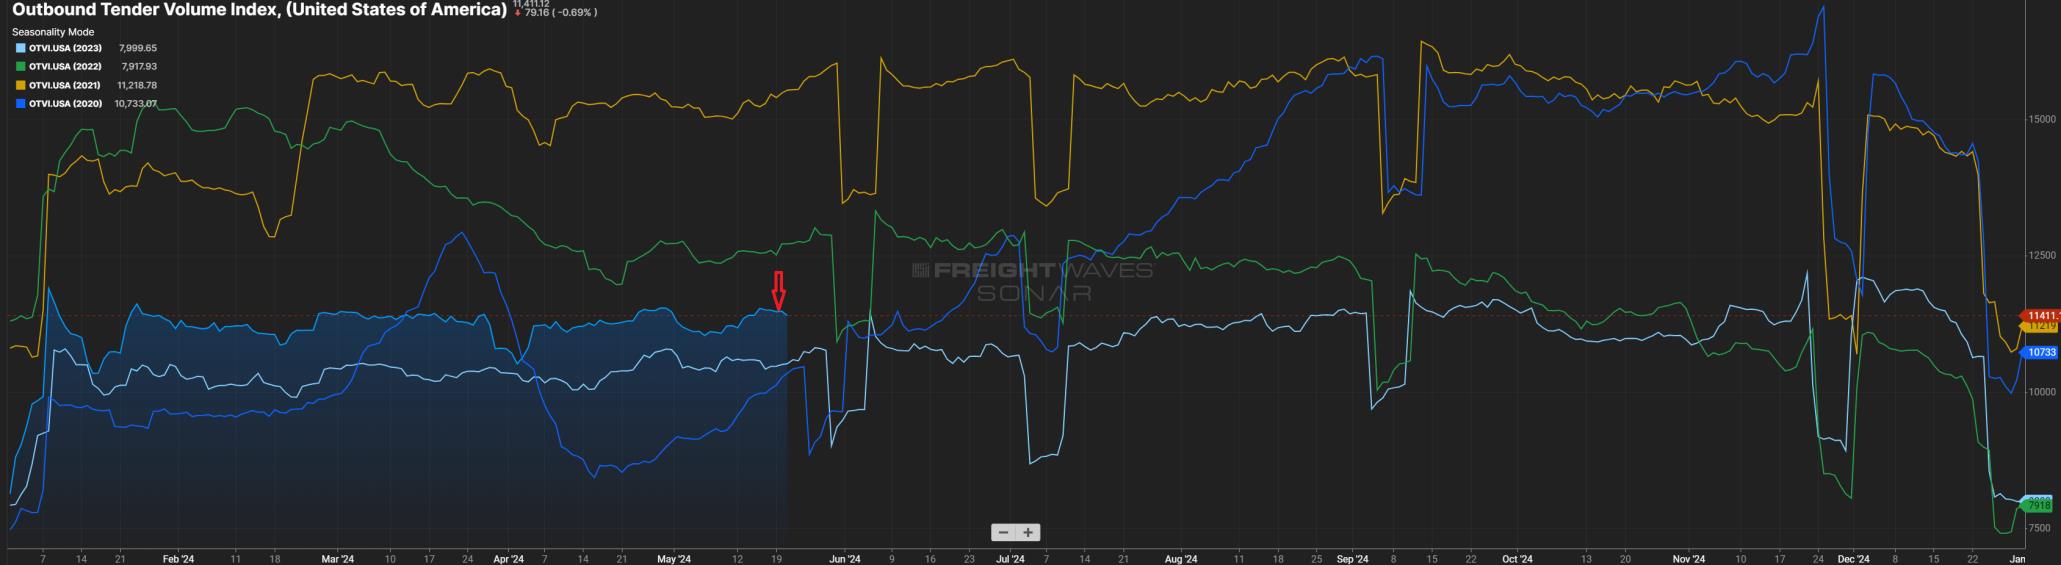
For the majority of this year, volumes have seen their traditional seasonal patterns and have been trending above 2023 levels. Many have commented that market balance will be driven more by carrier attrition versus an event that spurs freight volumes.
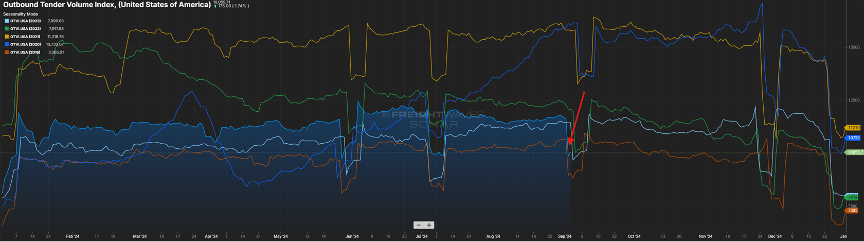
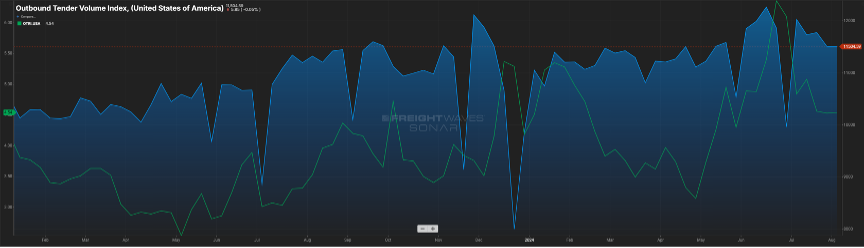
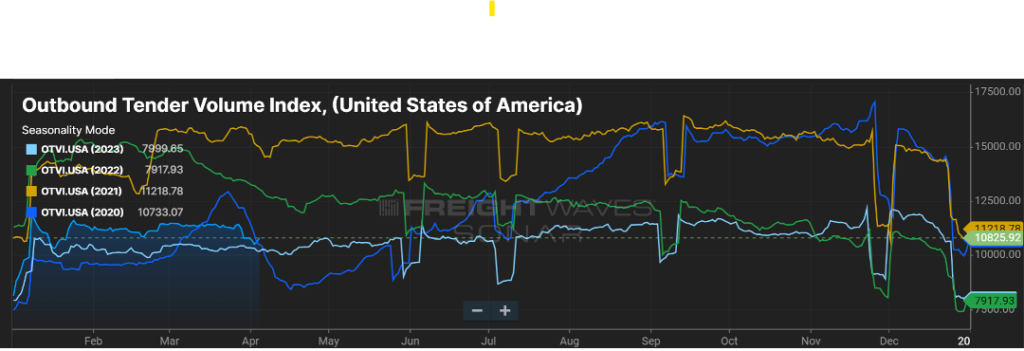
2022 was a pretty good year from an industry standpoint. Volumes were still elevated (certainly not like we saw in 2021) and capacity was inline. While it may be a blip on the radar, we have now seen the Outbound Tender Volume Index eclipse 2022 levels for the first time in two years as seen in Figure 1.1.
I think it is still too early to pin the volume uptick on the interest rate reduction or the recent hurricanes that severely impacted states in the southeast, but these events, and any potential storms that might still pop up (hurricane season isn’t quite over yet), could impact freight volumes in the coming months. Combined with consumers continuing to spend, volumes could remain consistent through the end of the year versus following their traditional end of year downward movement.
FINE….FOR NOW
While there was a sigh of relief from many with the ILA and USMX reaching a deal on wage increases for dock workers, this does not mean that everything is resolved, and potential port disruptions could occur at the 20-something docks along the East and Gulf coast.
Union-member wages were the major bargaining chip that was agreed upon last week, with dock workers receiving an immediate pay increase, with yearly pay increases to follow. When all increases have taken effect, dock workers will see a 62 percent increase in pay. One issue that was not finalized was the use of automation at select ports, which the labor union has opposition to full and semi-automation. The two sides will continue their negotiation discussions, with a timetable of three months from now to finalize a deal.
If these points can’t be resolved, it may be rinse and repeat with the threat of another strike as we get into the start of 2025.
Speaking of the recent shut down of port activity, it will take a week or so to work through the container backlog. This, along with the disruption in shipping patterns caused by the recent hurricanes, has been impacting tender rejection rates as seen in Figure 2.1.
Rejection rates crested the five percent mark recently. As port activity comes back online, expect the volume for short haul shipments (<250 miles) to remain elevated as also seen in Figure 2.1.
Stay Up To dAte
Looking for a more frequent update? Subscribe to our newsletter and receive the top five logistics articles of the week every Friday morning by selecting “Weekly News Update” when you select your preferences.
Get Weekly News Updates in Your InboxStay up to date on the latest information on conditions impacting the freight market, curated by Trinity Logistics through our Freightwaves Sonar subscription.
YES, IT IS IMPORT-ANT
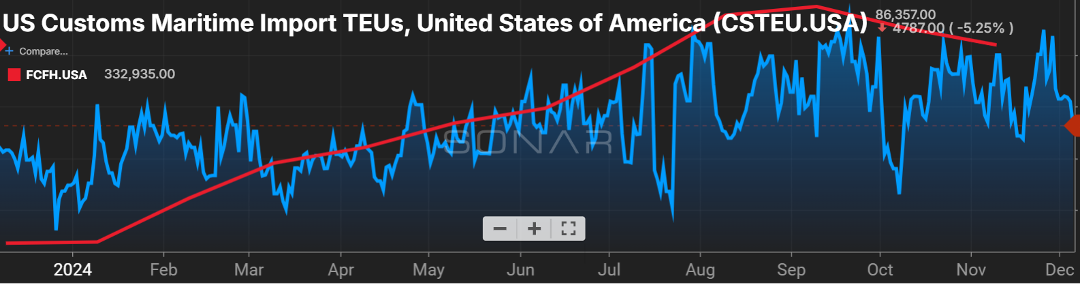
There has been much buzz in the last month around inbound container volumes to U.S. ports. There are 300+ ports of entry for goods into the country, with much of that volume handled by the top 20. Most of that buzz is around the uptick in volume.
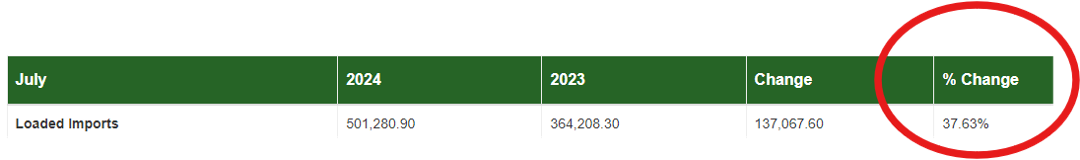
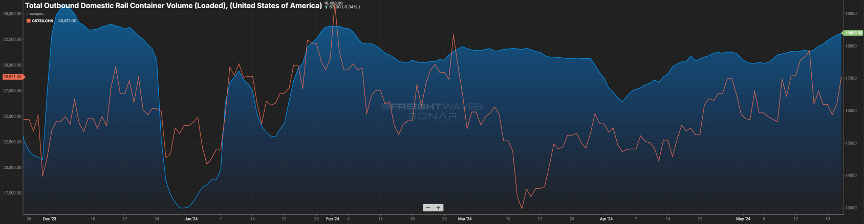
In figure 1.1, you will see for the port of Los Angeles, the largest in the country, that container volume is up almost 38 percent. That’s certainly impressive, but the neighboring port (Long Beach) was up a staggering 60 percent.
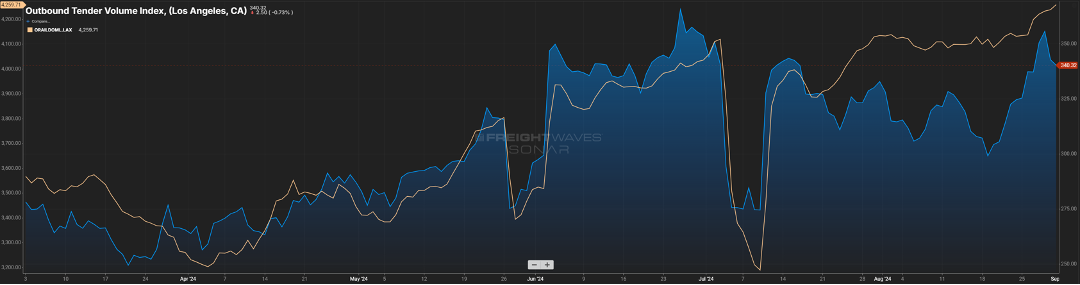
Many would anticipate this similarly impacting the outbound over-the-road volume for that market. And yes, while we see in Figure 1.2 via the blue line, there is a noticeable increase from what it was heading into the Memorial Day holiday, but it is not a direct correlation. The beige line represents the domestic rail volume from that same market, and unlike what we experienced in the “Covid years”, the rails have been a bigger mover of goods versus the bottlenecks we saw back then.
We should expect to see import volumes continue through the next few months. As goods produced overseas have become cheaper to buy, major retailers have taken advantage of these discounts with the anticipation of robust consumer spending. Remember, almost three-fourths of inbound volume is directly related to consumer purchasing. Good news for consumers as these retailers will want to liquidate this inventory quickly at lower prices.
NOT FAR FROM HEALTHY
While not in balance, the spread between contract and spot rates continues to shrink, now sitting about $0.60 per mile higher on the contract side. Keep in mind this gap was in the $0.75 to $0.90 for much of the past year. Almost in lockstep has been the tender rejection index. It has continued its slow upward movement as seen by the green line in Figure 2.1.
This can be attributed to capacity continuing to shrink slightly (Figure 2.2) and contract rates moving downward. It’s rare that spot rates will eclipse contract rates, but a spread of $0.40 to $0.50 is indicative of a healthier market, and we are not far from that right now.
I spent a few days traversing the state of Tennessee recently. At one stretch of a major interstate, there was a back-up at least five miles long. Luckily for me, it was on the eastbound side, and I was heading the opposite direction.
What struck me was the sheer number of trucks that sat idled. By my estimates, almost 80 percent of the volume was truck traffic. And while you can’t tell if a van is loaded or not, every single flatbed had freight on it. So, ladies and gentlemen, freight is still moving in this country. While it may not feel like it, volumes are trending close to 2022 levels as seen in Figure 3.1 (blue vs. green line). They say the fourth quarter is the time when carriers make hay; so here’s to an optimistic outlook for the next four months.
Stay Up To dAte
Looking for a more frequent update? Subscribe to our newsletter and receive the top five logistics articles of the week every Friday morning by selecting “Weekly News Update” when you select your preferences.
Get Weekly News Updates in Your InboxStay up to date on the latest information on conditions impacting the freight market, curated by Trinity Logistics through our Freightwaves Sonar subscription.
GOOD NEWS, BUT…
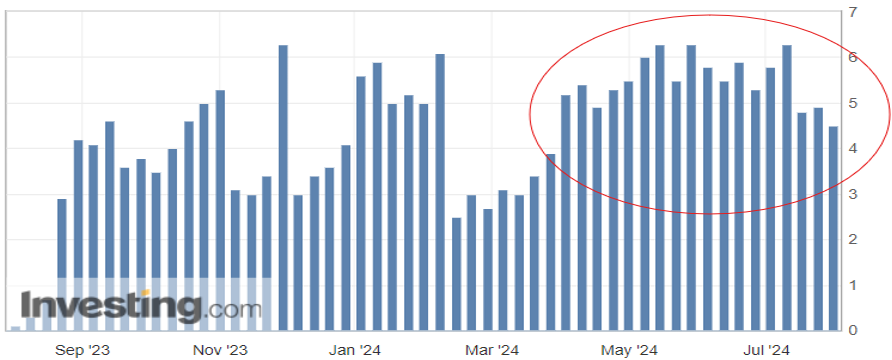
Consumer spending is the biggest driver of the U.S. economy, accounting for roughly two-thirds of the nation’s Gross Domestic Product (GDP). One measurement of that consumer spending is the Redbook index, which compares year-over-year growth for large domestic general retailers (think Walmart, Amazon, Target). The index has averaged just over 3.5 percent for the past 20 years, so the recent year-over-year (YoY) growth in the four-plus percent range speaks to the strength of consumer spending (Figure 1.1). This index alone certainly gives reason for optimism, however there is a cautionary tale with regards to consumer debt.
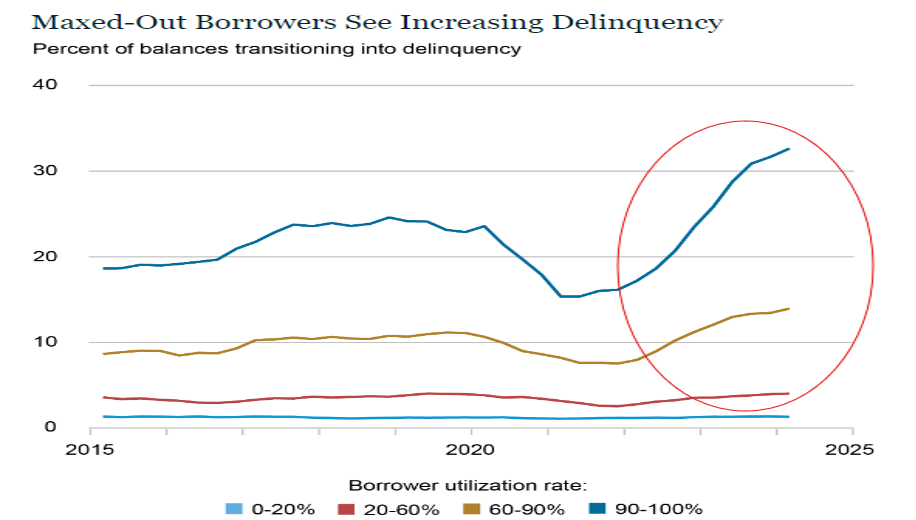
After years of next to zero interest rates to keep the economy on its legs, consumers have seen interest rates on the rise, with the federal funds rate at its highest level since the early 2000’s. With the increase in interest to borrow funds, combined with the increased costs of essentials (food, housing, energy), many households have turned to credit cards to fill the gap for funding of these necessities. Figure 1.2 from the New York Fed Consumer Credit Panel shows the rise in consumer delinquency particularly in those groups that utilize more than half of their available credit line.
While there appears to be relief on the horizon with the impending reduction in interest rates, it appears a portion of active consumers may be pulling back on purchases for those items that are not mission critical. This, in turn, will have an impact on restocking of inventories and trucking activity.
While it is not approaching the levels seen in 2021, the volume index is quickly approaching levels seen in 2022. This has buoyed optimism in the industry.
JUST SOME GOOD LUCK? TIME WILL TELL
The uptick in consumer spending, restocking of inventories and the threat of labor strife in the fourth quarter of this year has been to the benefit of those involved with the rail and import business.
In Figure 2.1 below, the blue line represents loaded container rail volume in the U.S. and the past three months have seen the volume grow. Similarly, container volumes to the U.S. have been on the rise.
The orange line represents container volume from China over the past six months. While some of that traditional volume is now flowing through other countries, like Mexico, there is still a great deal of activity with U.S.-China trade. Will this continue or is it fool’s gold? That is something we will continue to keep an eye on as a pullback in consumer spending will dictate how the needle moves.
STAYING RIGHT WHERE WE ARE
Finally, looking at domestic over-the-road volume (blue line) compared with carrier rejection rates (green line). The slight upward trend continues with volumes and rejection rates (Figure 3.1). Rejection rates continue to inch towards 2022 levels, but a five-to-six rejection rate is about half of what one would see in a balanced freight market.
This has yet to manifest itself in the way of increased freight rates, as capacity still exists in the market.Shippers and carriers should anticipate little change in conditions (although hurricane season is looming) until early 2025.
Stay Up To dAte
Looking for a more frequent update? Subscribe to our newsletter and receive the top five logistics articles of the week every Friday morning by selecting “Weekly News Update” when you select your preferences.
Get Weekly News Updates in Your InboxStay up to date on the latest information on conditions impacting the freight market, curated by Trinity Logistics through our Freightwaves Sonar subscription.
UP AND TO THE RIGHT
For the past year, the general direction of the Outbound Tender Volume Index (OTVI) has been on an upward trajectory as seen in Figure 1.1.
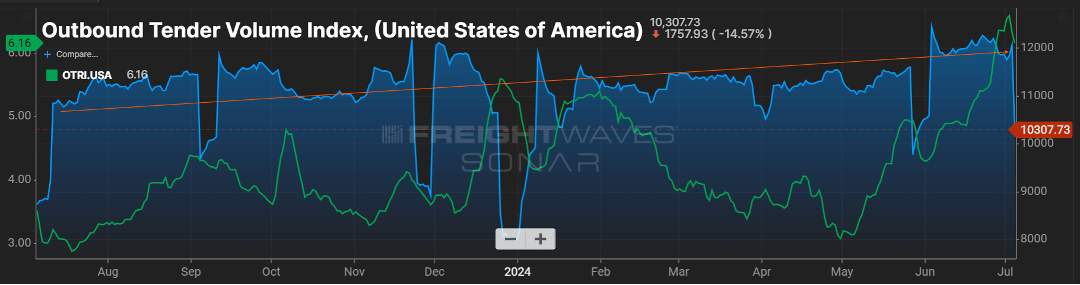
While it is not approaching the levels seen in 2021, the volume index is quickly approaching levels seen in 2022. This has buoyed optimism in the industry.
Another rise we’re keeping an eye on is the Outbound Tender Rejection Index, the rate at which carriers are saying “no” to freight where they have paper rates with a shipper. A six percent rejection rate may not sound important, but considering the rejection rate has stagnated in the three-to-four percent range for the past year plus, it’s another sign that the freight pendulum may be nearing more of a balanced market.
In 2021, rejection rates hovered in the 20-30 percent range. This was more a product of increased freight volumes and carriers realizing they could get higher rates in the spot market versus the contracted rates they had in place. The uptick in rejection now appears to be more of a limit of capacity in certain markets versus carriers hedging their bets on the open load board.
Drip, Drip, Drip
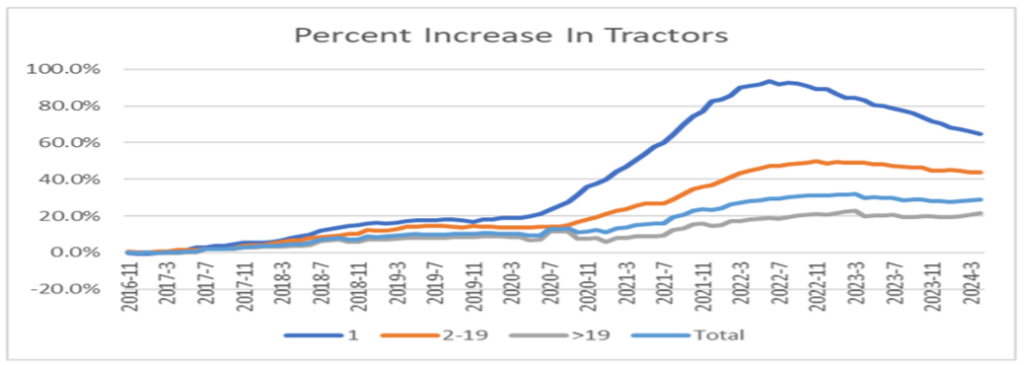
Speaking of that capacity, there is a reduction happening, albeit a slow drip. As shown in Figure 1.2, for the past year and a half, almost two years, the biggest reduction in capacity has been from the owner-operator segment. Most likely, the carriers in this group that have exited the market are those that rushed in when freight and rates were plentiful, and now are finding more normalized rates combined with high overhead to be unsustainable.
As shippers continue to look ahead, not having reliability among this segment of carriers could prove problematic as volumes escalate and more freight flows to the spot market, which is supported heavily by owner-operator drivers. This is a good reason for shippers to ensure they have a good mix of carrier and broker partners.
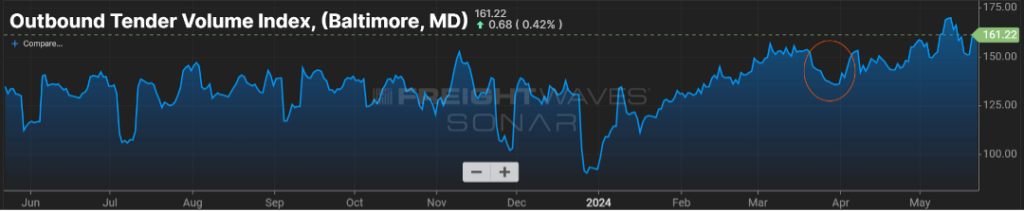
Baltimore Still Recovering
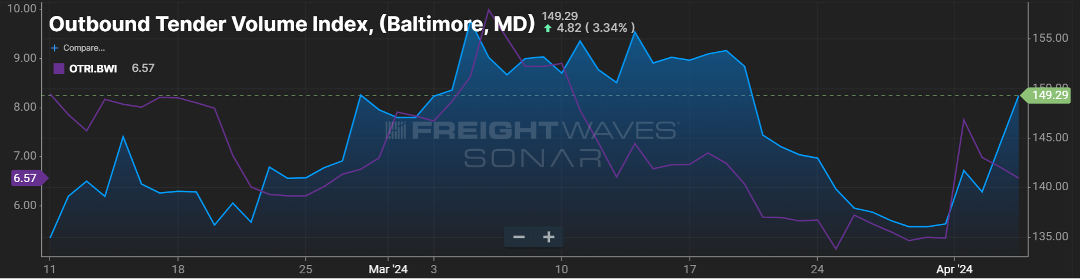
Finally, it has been just over three months since the bridge collapsed near Baltimore, MD. The waterways in the surrounding area appear to be returning to normal, and the need for traffic that populated the bridge to divert to alternate routes seems to be no worse for the wear on drivers.
Looking at volume in that market in Figure 1.3 since the end of March when the event occurred, after a slight dip when freight had to be re-routed, volumes as measured by the OTVI have increased just over 10 percent. Certainly, there is still work to be done, short- and long-term, but the Baltimore area appears to have powered through an unfortunate event.
Stay Up To dAte
Looking for a more frequent update? Subscribe to our newsletter and receive the top five logistics articles of the week every Friday morning by selecting “Weekly News Update” when you select your preferences.
Get Weekly News Updates in Your InboxStay up to date on the latest information on conditions impacting the freight market, curated by Trinity Logistics through our Freightwaves Sonar subscription.
A LOOK AT THE PAST AND FUTURE OF THE FREIGHT MARKET
The Outbound Tender Volume Index (OTVI) measures the volume of contracted freight in the U.S. While this does not account for the spot market, ebbs and flows in contract freight have a direct impact on spot market volume and pricing. The outlier on the graph below (Figure 1.1) is the yellow line, representing calendar year 2021. This was an unprecedented year for freight volume, primarily influenced by consumer spending. While many feel the freight market is suppressed, that is not necessarily the case. 2024 will follow a more traditional freight flow pattern, with volumes up five to eight percent, year-over-year (YoY).
Measuring the freight volume is not enough to predict swings in pricing. Being able to overlay the frequency in which carriers say “no” to freight tenders via the Outbound Tender Rejection Index (OTRI) gives a good picture whether the capacity side of the market can handle those swings.
The below chart (Figure 2.1) looks at the amount of contracted freight volume (blue line) with the frequency of tender rejections (green line) overlayed. As can see, most of 2019 and the first part of 2020 saw a market where freight volumes were easily handled. This was a result of lower than anticipated freight volumes versus a glut of carriers in the market.
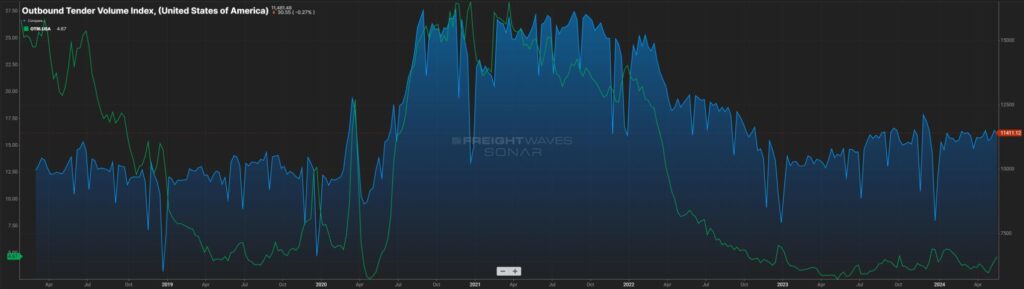
Then March 2020 happened. Everything went on lockdown. Volumes and rejection rates plummeted. That was quickly followed by a freight injection and for the latter part of 2020, and all of 2021, the market struggled with a lack of capacity to handle the record freight volumes.
For example, most LTL carriers were operating at 105-107 percent of capacity when they normally are in the low to mid-90s range. The freight market pendulum was in favor of the carriers. When the market gets hot, everyone wants in, which is what was happening in 2021, and 2022 – new carriers raced to get in on the action while existing carriers looked to soak up as much rolling stock as they could to capitalize on the market.
2023 saw a return to more traditional levels, but the capacity remained. As a result, rejection rates for freight tenders took a dive to below five percent, indicating carriers were eager for any freight that kept their fleets moving. This caused freight rates to take a dive (Figure 3.1) and then stabilize as of late.
But how long will shippers be able to rely on rate stability? Most likely the best determination will be the pace at which carriers exit the market.
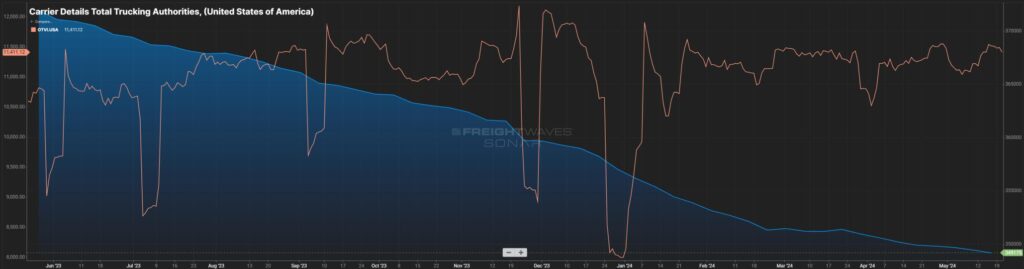
Figure 4.1 clearly shows capacity has been coming out of the market (blue line) for the past year. Most of that capacity is small – micro-fleets and owner operators. Certainly, this is dwindling capacity, but not to the extent of a large carrier pulling out of the market. A slow drip for sure.
The orange line represents the OTVI (volume) in the market, and that has slowly climbed over the last 12 months with the normal seasonal up and downs. At some point, as the volume inches up and capacity comes down, it’s simple supply and demand. Many are pointing to the end of this year, more likely spring of 2025 when that balance starts to shift. Now is the time for shippers to learn the contingency plans that are in place with their carrier and broker providers to account for this.
Stay Up To dAte
Looking for a more frequent update? Subscribe to our newsletter and receive the top five logistics articles of the week every Friday morning by selecting “Weekly News Update” when you select your preferences.
Get Weekly News Updates in Your InboxStay up to date on the latest information on conditions impacting the freight market, curated by Trinity Logistics through our Freightwaves Sonar subscription.
FREIGHT VOLUMES ARE ACTUALLY UP
It seems much of the news clippings have been around freight rates and how they remain suppressed. One could jump to the conclusion that this is a result of freight volumes being down. On the contrary, freight volumes are elevated from what we saw in 2023.
As you can see in Figure 1.1, volumes for the majority of 2024 are between six to eight percent higher compared to 2023. What is driving (or not driving) rates remains the capacity in the market.

Capacity is showing a net decline, albeit slower than expected. Much of that reduction is being felt in the less-than-10 tractor-fleets, so while the number of for-hire carriers is declining, the impact to actual trucks to haul freight is a slow drip.
That capacity continues to hold tender rejection rates at extremely low levels, meaning few loads are hitting the spot market. As a result, spot rates remain almost $0.70 per mile less than contracted rates. There has been some closing of the gap over the past year, as shown in Figure 1.2, but look for the gap to remain relatively consistent for the remainder of the year.

The Aftermath of The Francis Scott Key Bridge Collapse
It has been about six weeks since the bridge collapse in Baltimore. Removal efforts continue and certainly, a return to normal traffic flow is years away.
In positive news, looking at the *headhaul index for that market (Figure 1.3), aside from the drop around the time of the collapse, things appear to be back to normal from a balance standpoint. Certainly, there are more out-of-route miles and freight that may be entering at nearby ports, but for the most part, outbound and inbound freight volumes appear to be back to normal for the Baltimore market.
*headhaul measures the variance in outbound versus inbound freight

Stay Up To dAte
Looking for a more frequent update? Subscribe to our newsletter and receive the top five logistics articles of the week every Friday morning by selecting “Weekly News Update” when you select your preferences.
Get Weekly News Updates in Your InboxStay up to date on the latest information on conditions impacting the freight market, curated by Trinity Logistics through our Freightwaves Sonar subscription.
FRANCIS SCOTT KEY BRIDGE IMPACT
Watching the video of the bridge collapse was surreal. To have that structure there one minute, then five seconds later be completely gone, was jaw-dropping. Certainly, our thoughts and prayers are with those whose lives were impacted by the collapse.
Since the incident, clean-up has begun and a temporary waterway has been established, but it will take a while for the port to fully recover, let alone the bridge itself to be rebuilt. While the 30,000 plus vehicles that regularly cross that bridge is a sizable number, it’s about one-sixth of the volume that uses nearby major thoroughfares like I-695 or I-95 in the Baltimore area. Still, that traffic will need to go somewhere.
From the trucking side, there will likely be two main areas of impact. First, local freight that is destined for ocean travel will now need to find another port of departure, likely destinations the ports of NJ/NY; Philadelphia; and Norfolk, VA. This means more freight will be heading out of the Baltimore area.
Figure 1.1 below shows that since the end of March, right around the time of the bridge collapse, outbound volume, and freight tender rejection rates, have trended upward. Second, freight that travels around the Baltimore area will likely incur more out of “normal” route miles if the bridge was part of its route.
More carrier miles = more time to deliver = less time for other freight = increased freight costs.
SOME BALANCE SEEN
Overall, freight volumes have trended slightly above 2023 (Figure 2.1).
This has not dramatically impacted freight rates nationally or freight tender rejection rates. Excess capacity continues its slow runoff, and March saw an uptick in for hire carriers.
On a more granular scale, flatbed freight seems to be more optimistic. As seasonal flatbed type freight, combined with an uptick in industrial production and manufacturing activity is occurring, it has pushed flatbed rejection rates to more normal levels over the past few months as seen in Figure 3.1.
Flatbed rejection rates reached their highest point in over a year recently, and a 15 percent rejection rate is indicative of a more balanced freight market, if only for a certain equipment type segment.
Stay Up To dAte
Looking for a more frequent update? Subscribe to our newsletter and receive the top five logistics articles of the week every Friday morning by selecting “Weekly News Update” when you select your preferences.
Get Weekly News Updates in Your Inbox