
02/17/2026 by Greg Massey
February 2026 Freight Market Update
Get the latest insights shaping the logistics industry with Trinity’s February 2026 Freight Market Update, powered by our Freightwaves Sonar subscription.
last year’s playbook doesn’t work anymore
What a difference a year makes! This time last year, carriers were saying “yes” on almost every load tender that came their way. Fast forward 12 months, and tender rejection rates are 2-3x what they were at the start of 2025.
Figure 1.1 shows the breakdown by van (yellow), reefer (blue) and flatbed (white).
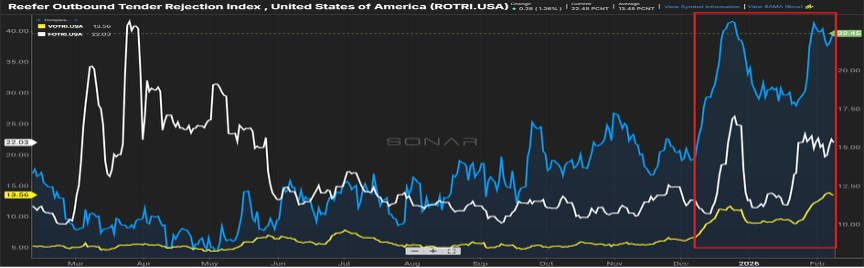
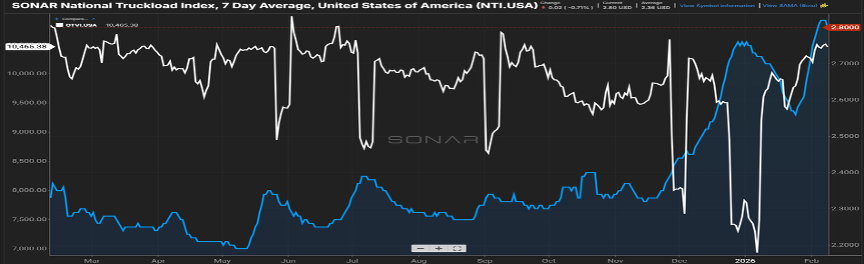
The recent weather certainly has been a secondary catalyst to an already escalating rejection trend seen from carriers towards the end of last year. As a result, it has (Figure 1.2) pushed spot rates 20% higher year-over-year, even as volume has remained stagnant.
carriers are keeping their options open
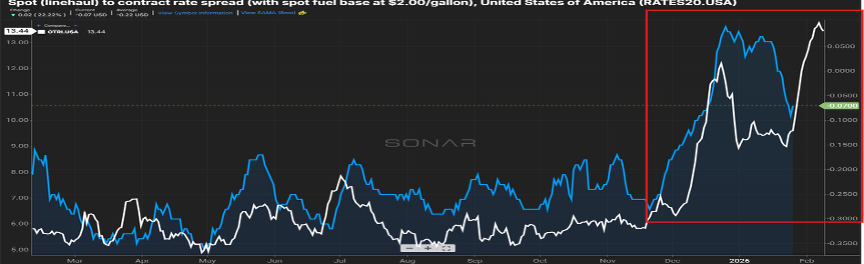
With spot rates on the rise, the delta compared to contract rates has become almost nil (Figure 2.1).
Contract carriers may be constrained by lack of capacity versus several months ago in certain areas, however it’s also plausible that carriers (and typically those that don’t have a minimum acceptance threshold on contracted freight) are very capable of providing the needed capacity, but simply hedging their bets on a better paying, similar lane on the spot market.
Shippers are no doubt having to reach further down their list of carriers and even forcing more freight to the spot market.
carriers are keeping their options open
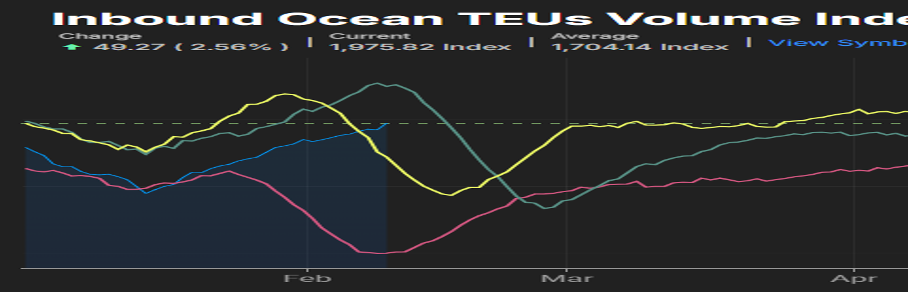
While Figure 3.1 below, which shows the inbound container volume to the U.S., could give reason for optimism when you compare the current year (blue) to past years, it’s a bit of fool’s gold for continuing the ascent.
This year, the Chinese New Year (also known as the Lunar New Year) will occur between February 17th and March 3rd. Prior years have seen the New Year begin in late January or early February. U.S. inventories have declined over the past year, and tariff or no tariff, shippers will have no choice to restock in the face of consumer demand.
It’s anticipated that imports will follow a traditional seasonal pattern sans the later than normal decline that always happens around the Chinese New Year.
Stay Ahead of the Market
Enjoyed the February 2026 freight market update? Subscribe to our email list to receive next month’s delivered straight to your inbox in our monthly newsletter. Looking for more frequent insights? Choose our Weekly News Update for logistics news in your inbox every Friday morning.
Don't Miss the Next One – Sign Up