
07/15/2026 by Amanda Lloyd
July 2026 Freight Market Update
Get the latest insights shaping the logistics industry with Trinity’s July 2026 Freight Market Update, powered by our Freightwaves Sonar subscription.
A Market in Transition
The freight market rarely changes overnight. Instead, it evolves through a series of shifts across the supply chain, beginning with imports, flowing through domestic transportation networks, and ultimately influencing carrier capacity.
This month’s FreightWaves SONAR data highlights three interconnected trends shaping the market. Inbound ocean volumes remain elevated, domestic freight demand continues recovering, and carrier rejection rates remain elevated compared to one year ago.
While each metric tells part of the story, together they point to a freight market that continues moving toward a healthier balance between supply and demand.
30 Second Market Pulse
If you only have a minute, here’s this month’s freight snapshot.
- Inbound ocean container volumes remain above their recent six-month average.
- Domestic freight demand continues recovering from the lows experienced earlier this year.
- Carrier rejection rates remain significantly higher than they were throughout much of 2025.
- Capacity conditions continue varying across regional freight markets.
- Overall market conditions continue pointing toward a more balanced freight environment.
Imports Continue Feeding Domestic Freight
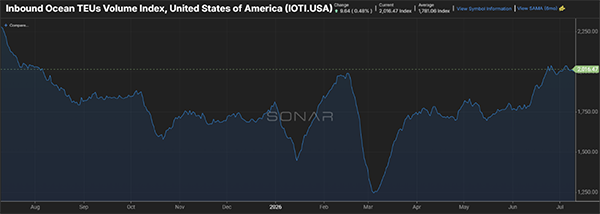
Import activity remains one of the leading indicators of domestic freight movement.
Inbound ocean container volumes have remained above their recent six-month average, suggesting imported freight continues entering the domestic transportation network at a healthy pace. While import activity naturally fluctuates throughout the year, continued strength provides an encouraging signal for freight moving through the supply chain.
As containers move through U.S. ports, they create demand across drayage, intermodal, and truckload transportation before ultimately reaching manufacturers, distribution centers, and retailers.
While import volumes alone do not determine market conditions, they remain an important indicator to watch as freight continues flowing inland.
Domestic Freight Demand Continues Recovering
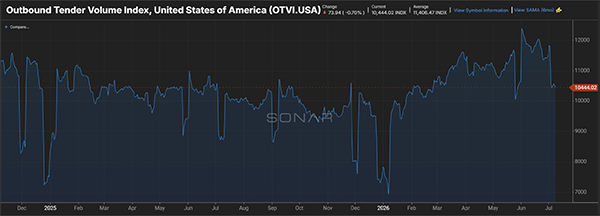
Following a slower start to 2026, freight volumes have steadily improved throughout the spring and into early summer.
While activity has moderated slightly in recent weeks, freight demand remains well above the lows experienced earlier this year, reflecting continued improvement as the market enters the second half of 2026.
Rather than experiencing a sudden surge, freight volumes have shown a gradual and sustained recovery. Combined with strengthening import activity, the trend suggests freight continues moving through the domestic transportation network at a healthier pace than it was just a few months ago.
Capacity Continues Tightening
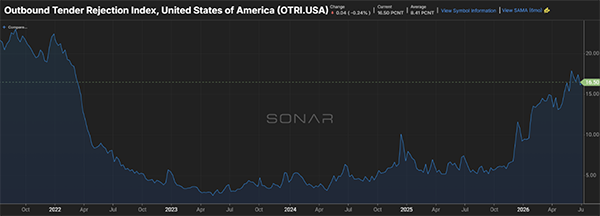
As freight demand continues improving, carrier behavior continues evolving alongside it.
Current outbound tender rejection rates remain significantly higher than they were during the same period last year and continue running well above recent averages. While today’s market remains well below the extraordinary capacity constraints experienced in 2021 and early 2022, rejection rates have steadily recovered from the historic lows that characterized much of 2023 and 2024. Taken together, these trends suggest the industry continues moving away from a prolonged period of excess capacity toward a more balanced freight environment.
For shippers, the takeaway is not that capacity is unavailable. Rather, carrier availability is becoming increasingly dependent on market conditions, equipment type, and lane.
Regional Market Watch
One Freight Market Doesn’t Tell the Whole Story
National indicators provide valuable context, but regional markets help explain where those changes are occurring first.
Looking across several major freight hubs, carrier rejection rates remain elevated, although the pace and intensity vary by market. Import gateways, manufacturing centers, and major distribution markets are each responding differently as freight demand continues strengthening.
Savannah, GA
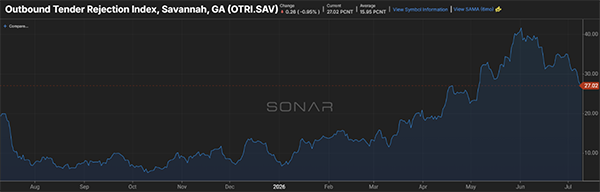
Savannah recorded the highest rejection rate among the markets reviewed this month. As one of the nation’s fastest-growing port markets, elevated rejection rates suggest continued demand moving through the Southeast and into inland distribution networks. While rejection rates have eased slightly from recent highs, capacity remains considerably tighter than earlier this year and well above the market’s recent average.
Atlanta, GA
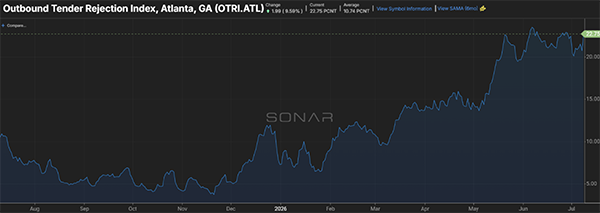
Atlanta continues exhibiting one of the highest rejection rates among the markets reviewed. As a major Southeast distribution hub, elevated rejection rates suggest sustained freight demand and continued carrier selectivity.
Dallas, TX
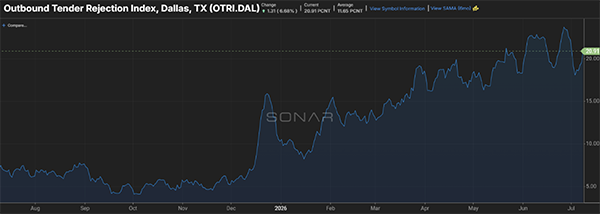
Dallas has experienced a steady climb in rejection rates throughout 2026. Manufacturing activity, regional distribution, and cross border freight continue supporting a consistently active transportation market.
Chicago, IL
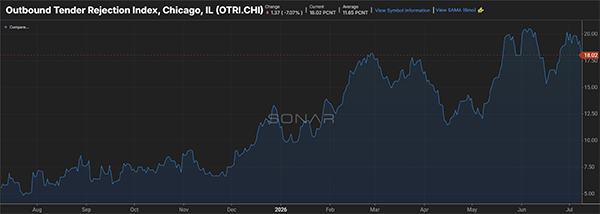
Chicago remains one of the nation’s largest freight gateways. While rejection rates have fluctuated throughout the year, they continue trending well above where they began, reflecting ongoing freight movement across both truckload and intermodal networks.
Harrisburg, PA
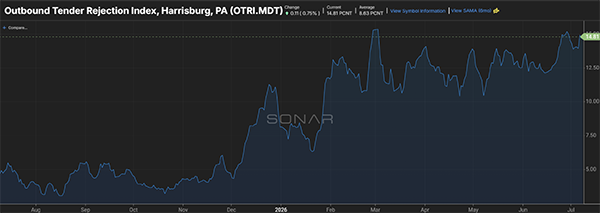
Harrisburg has maintained relatively steady rejection rates while supporting consistent retail replenishment and Northeast distribution activity. Although less volatile than other markets, carrier capacity remains tighter than earlier this year.
Ontario, CA
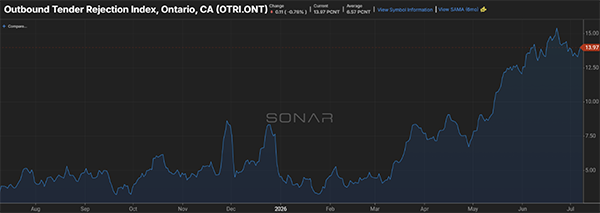
Ontario experienced one of the more noticeable increases during the second quarter. As one of the country’s largest inland distribution markets supporting West Coast imports, the trend coincides with continued strength in inbound ocean freight moving into domestic transportation networks.
Looking Ahead
The freight calendar continues to evolve. Instead of waiting for a clearly defined peak season, transportation demand is increasingly being influenced by a combination of import activity, inventory strategies, manufacturing expansion, infrastructure investment, and changing global trade patterns.
This month’s data reflects that shift. Import activity remains healthy, domestic freight demand continues recovering, and carrier rejection rates have steadily increased from the historic lows experienced over the past two years.
While traditional seasonal trends still matter, they are becoming just one of several factors influencing freight movement throughout the year.
As the industry moves deeper into the second half of 2026, understanding where demand is developing may become just as important as understanding how much demand exists. Regional market conditions, transportation mode, and freight mix will continue shaping how capacity responds in the months ahead.
What We’re Watching Next Month
As we move into August, these are the market indicators our Team will be watching closely.
Import Activity
Will inbound ocean volumes remain above recent averages and continue supporting domestic freight movement?
Freight Demand
Can outbound tender volumes maintain the steady recovery established throughout the first half of 2026?
Carrier Capacity
Will rejection rates remain elevated as season freight activity increases, or begin stabilizing as additional capacity enters the market?
Regional Markets
Which freight markets continue tightening, and do regional trends begin influencing broader national conditions?
Intermodal
Will strengthening import activity and continued domestic freight demand create additional momentum for intermodal transportation?
Don’t Let Market Shifts catch you off guard
Freight conditions can shift quickly and have a major impact on your transportation strategy. Subscribe to receive our monthly Freight Market Update in your inbox and also have the option to receive our Weekly News update for a quick Friday morning snapshot of what’s shaping the market.
Don't Miss the Next One – Sign UpLooking for a more reliable transportation strategy? Request a free quote for your next shipment and see how Trinity helps shippers stay flexible in changing market conditions.
Quote Your Next Shipment With Trinity