06/16/2025 by Greg Massey
June 2025 Freight Market Update
Stay up to date on the latest information on conditions impacting the freight market, curated by Trinity Logistics through our Freightwaves Sonar subscription.
Exit Stage Left
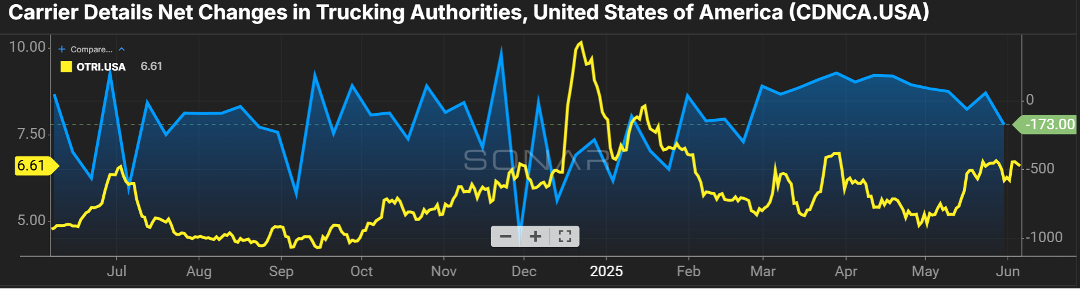
The slow but consistent exit of carriers from the freight market continues.
Figure 1.1 shows a theme of negative net authorities in the for-hire carrier market thus far in 2025. This continues the trend from last year, when there were 13,000 fewer carriers in the market at the end of the year versus compared to the start, an almost four percent decrease. Operating costs, tariff-related increases in equipment and parts, and a stricter mandate on driver proficiency in English will continue to negatively impact the number of drivers and carriers in the market.
Where this impact will be most pronounced is the tender rejection rate, the frequency in which carriers say “no thank you” to a shipment offered to them. I don’t foresee the rejection rates we experienced in the latter part of ’20 and all of ’21, which were in the 20-30 percent range, happening. However, we are quickly approaching double-digit rejection rates which would signal a more balanced supply and demand freight market.
Shippers have been working with the luxury of not having to reach too far into their routing guides and carrier and broker partners. As the recent trends continue, freight acceptance compliance will become more challenging for them.
West Coast Ports Heat Up Again
The one thing that is somewhat unpredictable right now is import volumes and their impact on the freight market.
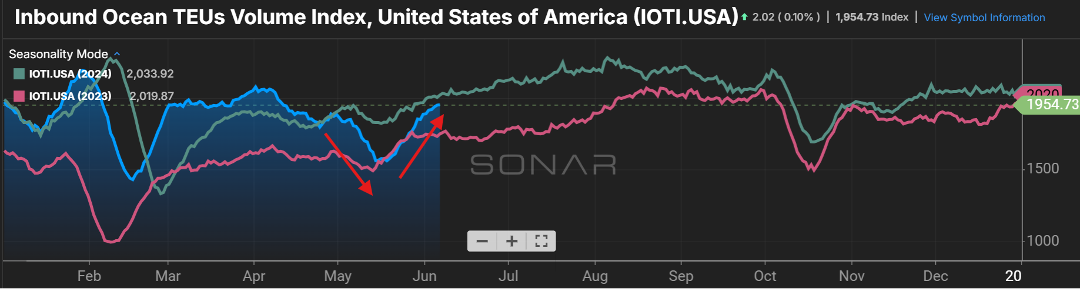
Figure 2.1 shows the slowdown of freight from overseas, most of which affected our West Coast ports. Once a handshake deal was in place to stave off steep tariffs with China, ships pulled up their anchors and chugged across the waters destined for the U.S.
Import volumes have recently surpassed 2023 levels and are soon to close in on 2024 volumes. Most of this freight will be more of a “just in case” scenario versus “just in time”. This will see a greater benefit to the rail industry versus truckload market, as freight that is not time sensitive has the luxury of taking longer to arrive at its destination at a lower cost.
Expect to see some volatility in truckload pricing in and around the LA/LB ports as capacity and freight volume imbalances collide.
Stay Up To dAte
Looking for a more frequent update? Subscribe to our newsletter and receive the top five logistics articles of the week every Friday morning by selecting “Weekly News Update” when you select your preferences.
Get Weekly News Updates in Your Inbox