
05/15/2025 by Greg Massey
May 2025 Freight Market Update
Stay up to date on the latest information on conditions impacting the freight market, curated by Trinity Logistics through our Freightwaves Sonar subscription.
Freight in Retreat
A picture is worth a thousand words.
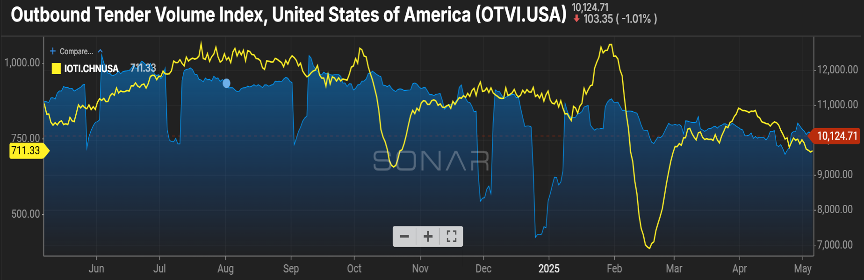
Figure 1.1 shows the initial impacts of the tariffs with regard to ocean containers and over-the-road trucking volumes. As you see by the yellow line, shippers were eager to get ahead of the pending tariffs with freight from China. But as the tit for tat trade war has continued, blank sailings and cancelled bookings are becoming common and has caused inbound container volume to trend downward, now sitting almost 20 percent less than this time last year.
This has translated into a regression in the over-the-road trucking volume, with the blue line starting to show a decline at time of year when freight volumes should be escalating with increased consumer activity and the start of produce season. Additionally, the lack of container volume has an impact on rail activity with total intermodal container volume receding five percent from where it was in March.
Carriers Struggle with Freight Shift
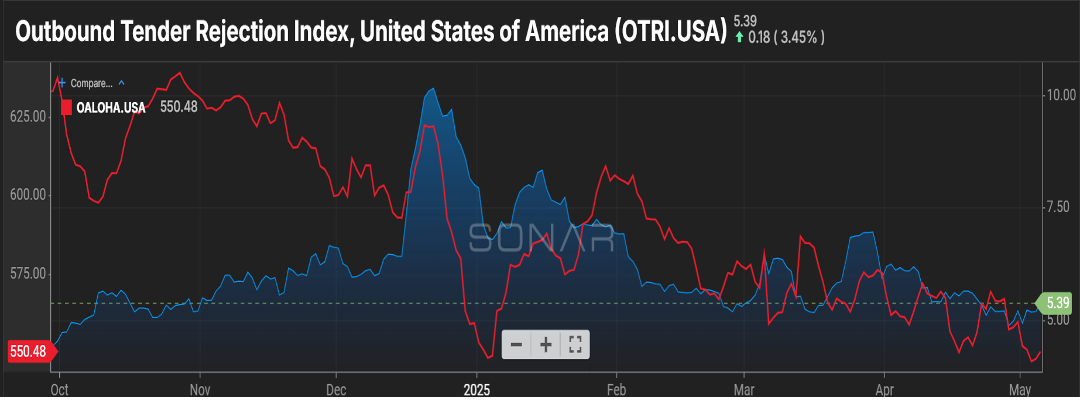
The rejection of freight tenders (OTRI.USA) has been relatively unchanged over the past month plus. This has been held up by a declining base of carriers. However, if you look at Figure 2.1 you will see via the red line that the average length of haul for shipments has been on a steady decline pretty much for the past year.
Yes, less import traffic plays into that, as those shipments typically head to larger metro areas (Chicago, Dallas) once they cross into our borders at the port. But a push for regionalization by shippers and an increase in e-commerce activity has also fueled more frequent but shorter distances for freight to travel, down about 12 percent from this time in 2024.
This is not great news for carriers as 75 miles less equates to a lower price they can command, but the mileage difference is not enough to allow them to compensate for the difference by additional freight moves during their work week.
Tariffs Price Out Small Carriers
The length and severity of the tariffs is not only having an immediate impact on trucking volumes, but it could be setting the industry up for a capacity shortage once calmer waters prevail. 25 percent tariffs on Mexican and Canadian imports have increased the cost of new trucks by almost $30,000, making it particularly challenging for smaller carriers to invest in new equipment, let alone new entrants to enter the carrier capacity market.
And for those looking to stretch the mileage out of older equipment, the increased cost for maintenance parts and fuel additives as a result of tariffs puts further strain on already tight budgets. Considering 93 percent of the for-hire carriers in the U.S. are less than 10 trucks, there could be a gaping hole to fill in the spot market when a freight rebound happens.
Stay Up To dAte
Looking for a more frequent update? Subscribe to our newsletter and receive the top five logistics articles of the week every Friday morning by selecting “Weekly News Update” when you select your preferences.
Get Weekly News Updates in Your Inbox