
04/16/2024 by Greg Massey
April 2024 Freight Market Update
Stay up to date on the latest information on conditions impacting the freight market, curated by Trinity Logistics through our Freightwaves Sonar subscription.
FRANCIS SCOTT KEY BRIDGE IMPACT
Watching the video of the bridge collapse was surreal. To have that structure there one minute, then five seconds later be completely gone, was jaw-dropping. Certainly, our thoughts and prayers are with those whose lives were impacted by the collapse.
Since the incident, clean-up has begun and a temporary waterway has been established, but it will take a while for the port to fully recover, let alone the bridge itself to be rebuilt. While the 30,000 plus vehicles that regularly cross that bridge is a sizable number, it’s about one-sixth of the volume that uses nearby major thoroughfares like I-695 or I-95 in the Baltimore area. Still, that traffic will need to go somewhere.
From the trucking side, there will likely be two main areas of impact. First, local freight that is destined for ocean travel will now need to find another port of departure, likely destinations the ports of NJ/NY; Philadelphia; and Norfolk, VA. This means more freight will be heading out of the Baltimore area.
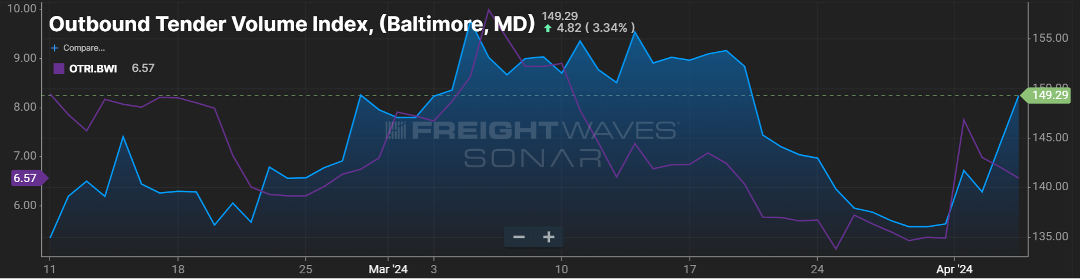
Figure 1.1 below shows that since the end of March, right around the time of the bridge collapse, outbound volume, and freight tender rejection rates, have trended upward. Second, freight that travels around the Baltimore area will likely incur more out of “normal” route miles if the bridge was part of its route.
More carrier miles = more time to deliver = less time for other freight = increased freight costs.
SOME BALANCE SEEN
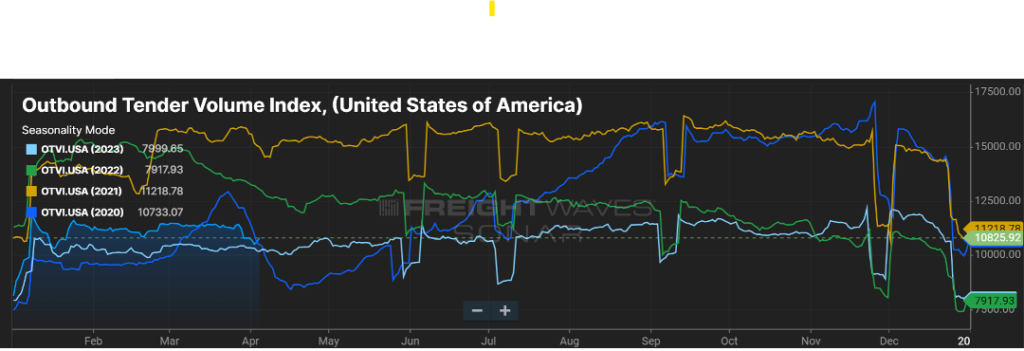
Overall, freight volumes have trended slightly above 2023 (Figure 2.1).
This has not dramatically impacted freight rates nationally or freight tender rejection rates. Excess capacity continues its slow runoff, and March saw an uptick in for hire carriers.
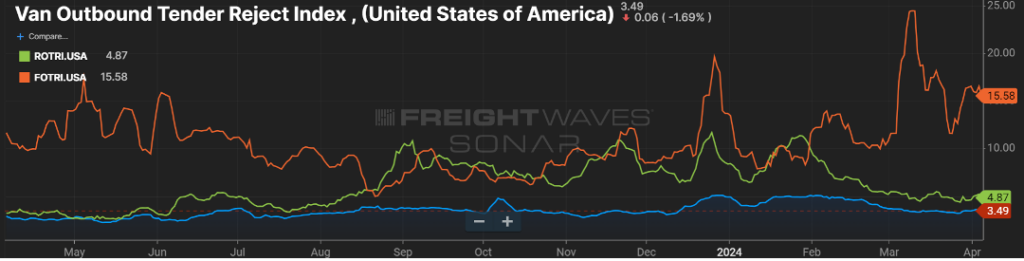
On a more granular scale, flatbed freight seems to be more optimistic. As seasonal flatbed type freight, combined with an uptick in industrial production and manufacturing activity is occurring, it has pushed flatbed rejection rates to more normal levels over the past few months as seen in Figure 3.1.
Flatbed rejection rates reached their highest point in over a year recently, and a 15 percent rejection rate is indicative of a more balanced freight market, if only for a certain equipment type segment.
Stay Up To dAte
Looking for a more frequent update? Subscribe to our newsletter and receive the top five logistics articles of the week every Friday morning by selecting “Weekly News Update” when you select your preferences.
Get Weekly News Updates in Your Inbox