

09/21/2026 by Amanda Lloyd
September 2026 Freight Market Update: Stability at the Surface, Differences Underneath
The freight market is becoming increasingly uneven as we head toward the final quarter of 2026.
Last month, we saw a market that had cooled from its early-summer highs but remained firmer than the softer conditions seen throughout much of the previous 2 years. September’s data adds another layer to that picture.
National freight volumes remain relatively stable, and tender rejections have continued to move lower from their summer peak. But that easing is not happening evenly. Flatbed capacity varies widely between individual markets, while rising diesel prices are creating a growing gap between all-in transportation rates and underlying linehaul pricing.
Broader logistics data tells a similar story. The Logistics Managers’ Index continued to expand in August, but at a slower pace, while transportation prices remained high.
The September data shows a market that has become more stable nationally, but more uneven underneath the averages. Capacity, cost, and freight activity increasingly depend on where freight is moving and how it is moving.
60 Second Freight Market Pulse
Here are the key numbers shaping the freight market this month:
- Tender rejections are at 12.54%. This is below the summer peak near 18%, but remains above the levels seen throughout much of 2024 and 2025.
- Tender volumes are approximately 10,191, slightly below the 12-month average of 10,307.
- All-in truckload spot pricing is approximately $3.44 per mile, while linehaul-only pricing is approximately $2.44 per mile.
- National flatbed tender rejections are 17.27%, but individual Midwest markets range from approximately 1.84% to 29.52%.
- The Logistics Managers’ Index registered 66.6 in August, down from 68.9 in July and 71.1 in June.
- National diesel reached $6.285 per gallon as of September 14, continuing the sharp increase seen since July.
The takeaway: National freight demand remains fairly steady, but capacity, pricing, fuel, and regional conditions are not moving in the same direction.
Freight Demand Remains Relatively Stable
National freight demand has changed little over the past month.
The Outbound Tender Volume Index (OTVI) currently sits at approximately 10,191, compared with its 12-month average of 10,307. Outside of normal holiday swings, volumes have remained within a fairly consistent range throughout 2026.
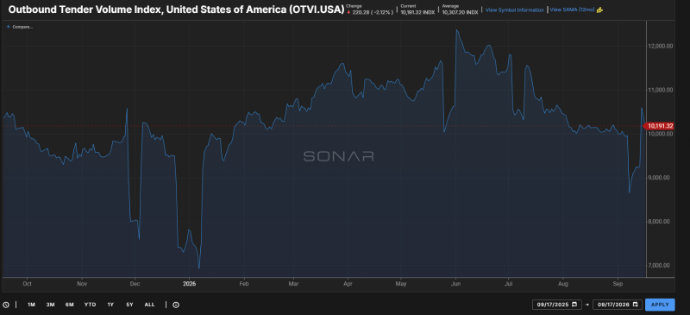
Outbound Tender Volume Index, One-Year Trend
Source: FreightWaves SONAR
Capacity tells a somewhat different story.
The Outbound Tender Rejection Index (OTRI), which measures the percentage of contracted loads rejected by carriers, currently sits at 12.54%. This is well below the summer peak near 18%, but remains above the levels seen throughout much of 2024 and 2025.
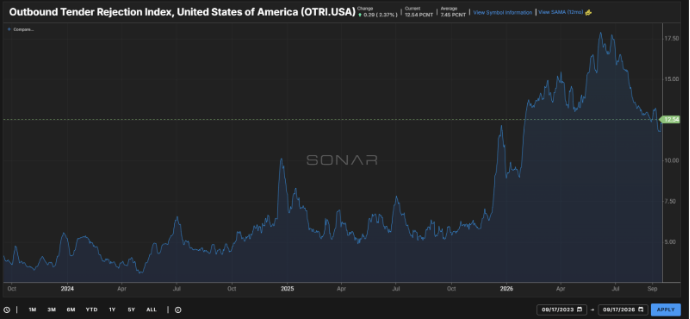
Outbound Tender Rejection Index, Three-Year Trend
Source: FreightWaves SONAR
Looking at these two indicators together provides a clearer picture. Freight volumes are not showing a major increase, yet carriers continue to reject more contracted freight than they did during much of the previous two years.
This suggests available capacity continues to play an important role in current market conditions, even without a major increase in freight demand.
Flatbed Markets Tell Very Different Stories
Flatbed provides one of the clearest examples this month of why national averages do not always reflect individual markets.
National flatbed tender rejections currently sit at 17.27%, down significantly from the spring and below the 12-month average of 24.80%.
But regional conditions vary widely.
Milwaukee flatbed rejections are approximately 1.84%, while Green Bay is approximately 7.82%. In Indiana, Fort Wayne is approximately 19.56%, while Indianapolis is considerably higher at 29.52%.
| FLATBED REJECTION — NATIONAL 17.27% vs 24.80% 12-mo avg. Capacity returning nationally. | MILWAUKEE, WI 1.84% vs 10.86% own avg. Buy-side leverage is wide open. | INDIANAPOLIS, IN 29.52% vs 17.27% national, and rising. Protect capacity. |
Flatbed Tender Rejection Rates by Market
Source: FreightWaves SONAR
Tender volume provides additional context. Both Green Bay and Fort Wayne experienced stronger flatbed activity during the spring before volumes moved lower through the summer.
The combination shows that flatbed conditions are not moving together across the Midwest. Wisconsin markets currently show lower rejection rates, while parts of Indiana continue to show higher rejection rates even with lower freight volumes.
The data does not tell us what is causing the difference, but it does tell us that freight volume alone does not explain it.
For flatbed freight, national averages are a useful benchmark. Market-level capacity provides the more complete picture.
All-In Rates Stay High as Linehaul Pricing Moves Lower
Transportation pricing requires a closer look this month because the headline rate and underlying linehaul rate are moving differently.
The SONAR National Truckload Index Daily, which includes fuel surcharge, currently sits at approximately $3.44 per mile, compared with its 12-month average of $2.97. It has pulled back from the early-July high near $4.00 but remains elevated.
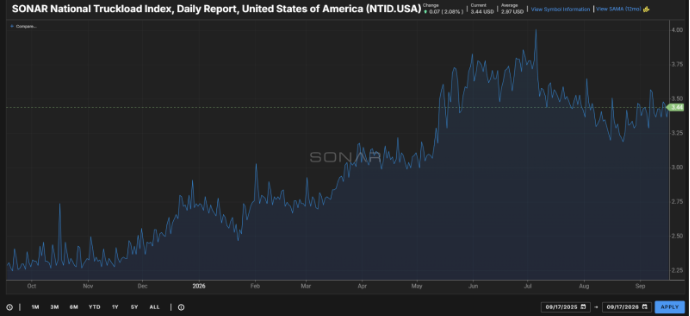
National Truckload Index Daily, One-Year Trend
Source: FreightWaves SONAR
Linehaul-only pricing tells a different story.
The National Truckload Index Linehaul is currently approximately $2.44 per mile. After climbing above $3.00 around July, the index moved lower through August and September.
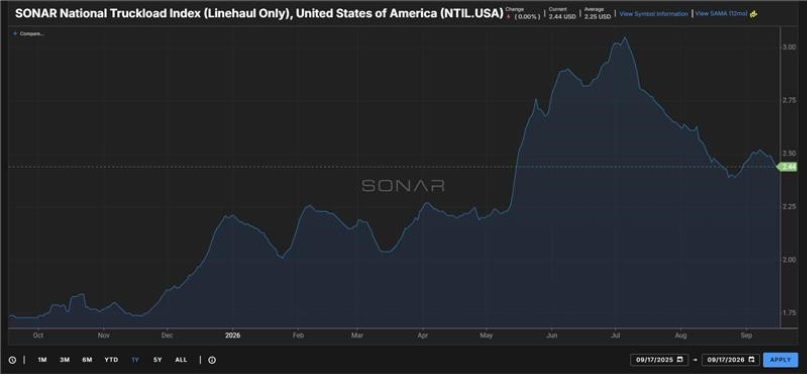
National Truckload Index Linehaul, One-Year Trend
Source: FreightWaves SONAR
At the same time, diesel prices have moved sharply higher.
National on-highway diesel reached $6.285 per gallon as of September 14, up $0.318 from the previous week. Regional differences remain significant, with the West Coast continuing to report the highest diesel prices in the country.
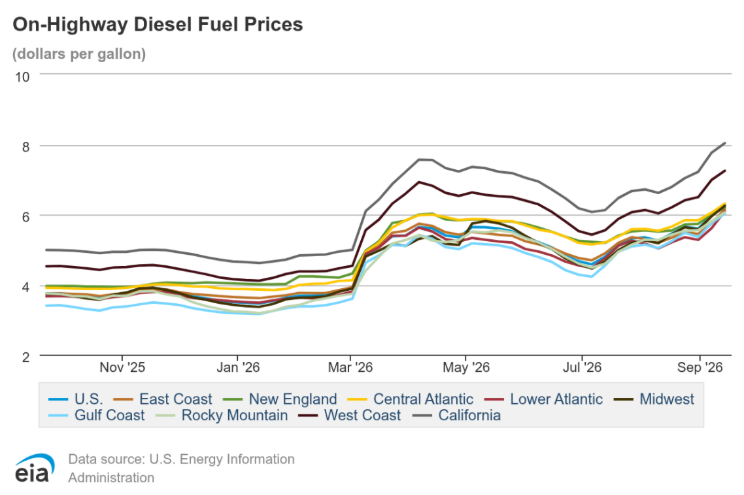
U.S. On-Highway Diesel Fuel Prices, One-Year Regional Trend
Source: U.S. Energy Information Administration
Put together, these indicators show why an all-in rate cannot be viewed as a measure of freight-market strength by itself. Linehaul pricing has moved lower from its summer peak while fuel has moved sharply higher.
For shippers reviewing transportation costs, separating linehaul from fuel provides a clearer view of what is actually changing in the market.
Import Activity Varies by Gateway
Import activity is also showing significant differences by gateway.
Long Beach inbound ocean volume is up approximately 81.7% year over year, while Los Angeles is down approximately 14.4%. New York/New Jersey is up approximately 8.7%, and Houston is up approximately 8.1%.
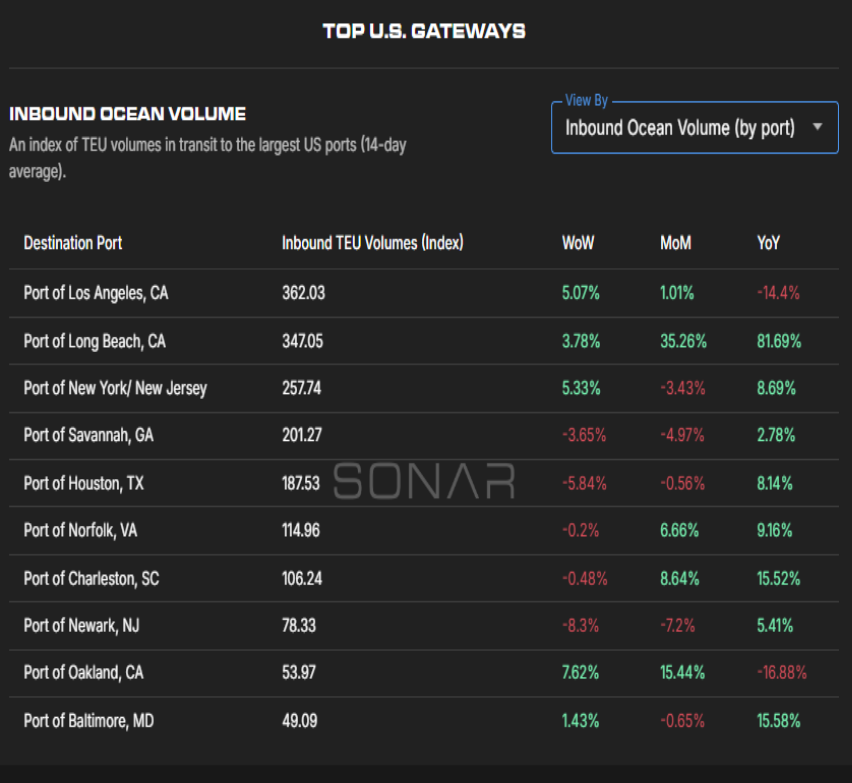
Inbound Ocean Volume by Major U.S. Gateway
Source: FreightWaves SONAR
Southern California provides a clear example of why gateway-level data matters. Long Beach and Los Angeles are neighboring ports, yet their year-over-year volume trends are moving in very different directions.
Domestic and international intermodal container volumes are also near the upper end of their one-year ranges.
Together, the data shows that import and inland freight activity should be evaluated by gateway and mode rather than through national totals alone.
Logistics Growth Slows While Transportation Prices Remain High
The broader logistics market continued to expand in August, but growth slowed for the second consecutive month.
The Logistics Managers’ Index registered 66.6 in August, down from 68.9 in July and 71.1 in June. A reading above 50 indicates expansion, meaning logistics activity continues to grow, but at a slower pace.
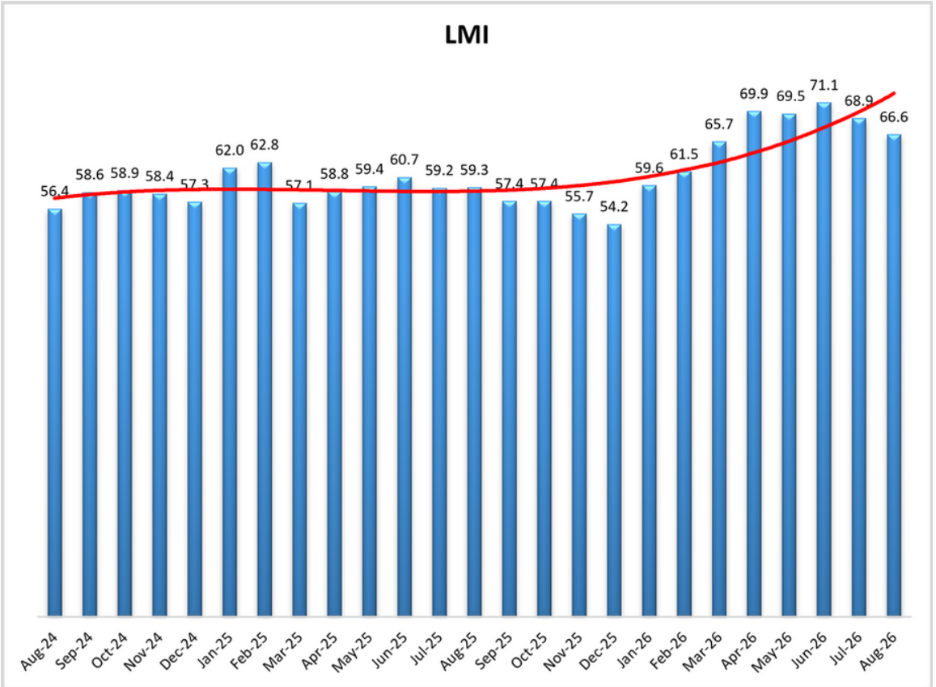
Logistics Managers’ Index Through August 2026
Source: Logistics Managers’ Index
The transportation components provide additional context.
Transportation Capacity registered 40.0, remaining in contraction. Transportation Utilization increased to 70.6, while Transportation Prices increased to 90.0.
The combination is important. The overall logistics market is growing at a slower pace, but transportation costs remain high.
Inventory is also worth watching heading into Q4. Inventory Levels registered 52.8, while Inventory Costs increased to 78.6. The August LMI also showed stronger inventory growth among downstream companies than upstream companies.
These indicators do not guarantee stronger freight demand ahead, but they provide useful context as companies move toward the final months of the year.
What This Means for Freight Planning
September’s freight data points to a market that requires more than one national benchmark.
Freight demand remains relatively steady, but available capacity varies by market. All-in transportation rates remain elevated, while underlying linehaul pricing has moved lower from its summer peak. Import activity also differs significantly by gateway.
For freight planning heading into Q4:
- Evaluate capacity at the lane and market level, particularly for equipment such as flatbed.
- Separate fuel from linehaul when reviewing transportation rates to better understand what is driving cost changes.
- Watch freight volume and capacity together. Higher rejection rates do not always mean demand is increasing.
- Follow regional and modal trends alongside national benchmarks, especially as Q4 shipping activity develops.
The freight market cannot currently be described as simply tight or loose. Where freight moves, the equipment it requires, and what is included in the transportation cost all matter.
What We’re Watching Next Month
- Carrier Capacity: Whether national tender rejections continue moving lower or begin to stabilize.
- Freight Demand: Whether Q4 shipping activity creates a meaningful change in tender volumes.
- Regional Flatbed: Whether the wide differences between Wisconsin, Indiana, and the national market continue.
- Transportation Pricing: How linehaul-only and all-in rates move relative to one another.
- Fuel: Whether diesel continues to rise, stabilizes, or begins to move lower.
- Ports and Intermodal: Whether the current differences in gateway and intermodal volumes continue as freight moves inland.
- Broader Logistics Activity: Whether LMI growth continues to slow and how its transportation components develop.
Don’t Let Market Shifts catch you off guard
Freight conditions can shift quickly and have a major impact on your transportation strategy. Subscribe to receive our monthly Freight Market Update in your inbox and also have the option to receive our Weekly News update for a quick Friday morning snapshot of what’s shaping the market.
Don't Miss the Next One – Sign UpLooking for a more reliable transportation strategy? Request a free quote for your next shipment and see how Trinity helps shippers stay flexible in changing market conditions.
Quote Your Next Shipment With TrinityMarket data sourced from FreightWaves SONAR, the Logistics Managers’ Index, and the U.S. Energy Information Administration. Market conditions and index values reflect the latest available data at the time of publication and are subject to change.