Stay up to date on the latest information on conditions impacting the freight market, curated by Trinity Logistics through our Freightwaves Sonar subscription.
From Peak to Plummet
Last month, we talked about the rise in import volumes and speculated on the impact of new tariffs or expiring pauses on current tariffs. Unfortunately, that came true in July, with import volumes dropping sharply as indicated in Figure 1.1. While import volumes have been up year-over-year for the first half of 2025, projections based on tariff impacts forecast a much lower second half.
Overall, the U.S. is forecasting an almost six percent reduction compared to last year. Yes, lower product demand attributed to rising costs is one driver of the YoY decline. But you may remember the tail end of 2024 saw a surge in import volumes due to the lack of certainty around labor issues at the East and Gulf coast ports, making the comps for the latter part of 2025 much more challenging.
With 136 days until Christmas, and based on anticipated cancelled and blank sailings, it may be wise to bundle your Christmas and Back-to-School shopping all in one.

PLENTY OF DRIVERS, BUT NOt DRIVING UP RATES
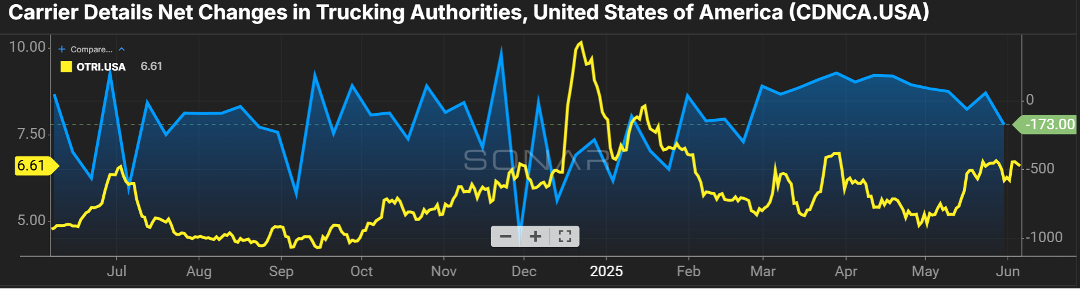
Overall carrier capacity continues to be fruitful, with August seeing a spike in net operating authorities as evidenced by Figure 2.1. This has driven down what was an escalating tender rejection rate over the last two months, with carriers saying “yes” to freight tendered their way almost 95 percent of the time.
With no reason to expect a surge in freight demand over the remainder of the calendar year, rejection rates remaining low will continue to keep carrier rates stagnant. 60 days ago, spot rates for carriers sat at $2.27. Today, that number is $2.28.
In general, the over-the-road freight market can be described like my golf game, “eehhhh”.

Stay Up To dAte
Looking for a more frequent update? Subscribe to our newsletter and receive the top five logistics articles of the week every Friday morning by selecting “Weekly News Update” when you select your preferences.
Get Weekly News Updates in Your InboxStay up to date on the latest information on conditions impacting the freight market, curated by Trinity Logistics through our Freightwaves Sonar subscription.
A TICKING TRADE CLOCK
Import volumes continue to rise, but for how long? Since the 90-day truce with China in early May, U.S. ports have continued to see volumes that rival and surpass those seen over the past few years (Figure 1.1).
While Chinese imports are a big driver of those volumes, they are not the only country feeding freight through our borders. A year-over-year (YoY) increase of four percent in shipment volume from China is nothing to sneeze at, but countries like Vietnam (52 percent YoY increase), Thailand (51 percent), and India (43 percent) have become more pronounced in their shipment volumes destined for the U.S.
With the 90-day pause now being extended until August 1st, it’s anticipated that volumes will remain elevated, but if tariffs are re-instituted, expect to see blank sailings and less volume coming through our ports, particularly the West Coast.

NOT YOUR AVERAGE SUMMER SLOWDOWN
While import volumes continue to surge, that volume is not translating to over-the-road shipments for the trucking industry.
As Figure 2.1 shows, the outbound volume index has remained relatively flat with the normal peaks and valleys for holiday periods. One area we are closely watching is the movement in the tender rejection index, the rate at which carriers are saying “No thank you” to shipments being tendered to them.
During the latter part of June and early July, rejections trended upward, cresting the eight percent mark. While that has seen a dip in the past few days, as have volumes, it’s anticipated to rebound to those levels in the coming weeks.
As most Americans tend to do, truck drivers also take advantage of the summer months for vacation time. Combined with the continuing trend of carriers leaving the market, and the still-to-be-determined impact of the English Language Proficiency mandate and enforcement, even if freight volumes are stagnant, less drivers to haul those shipments will cause rejections, and most likely rates, to rise.

REJECTION TRENDS BY EQUIPMENT
And speaking of tender rejections, not all rejections are created equally. There are many factors that influence a shipment being rejected by a carrier, one of which is the equipment required.
As Figure 3.1 shows, the rejection rate for shipments requiring a van (blue line) have been relatively flat. Flatbed (white line) capacity was a struggle in the spring months, but while still relatively high, at 15 percent, much less than what was experienced a few months ago.
Reefers continue to slowly trend upward, and produce seasonality has an influence this time of year, with one out of every nine shipments seeing the carrier reject the shipment opportunity.
Understanding what the trends are by equipment type will help as you are working on spot versus contract priced shipments.

Stay Up To dAte
Looking for a more frequent update? Subscribe to our newsletter and receive the top five logistics articles of the week every Friday morning by selecting “Weekly News Update” when you select your preferences.
Get Weekly News Updates in Your InboxStay up to date on the latest information on conditions impacting the freight market, curated by Trinity Logistics through our Freightwaves Sonar subscription.
Exit Stage Left
The slow but consistent exit of carriers from the freight market continues.
Figure 1.1 shows a theme of negative net authorities in the for-hire carrier market thus far in 2025. This continues the trend from last year, when there were 13,000 fewer carriers in the market at the end of the year versus compared to the start, an almost four percent decrease. Operating costs, tariff-related increases in equipment and parts, and a stricter mandate on driver proficiency in English will continue to negatively impact the number of drivers and carriers in the market.
Where this impact will be most pronounced is the tender rejection rate, the frequency in which carriers say “no thank you” to a shipment offered to them. I don’t foresee the rejection rates we experienced in the latter part of ’20 and all of ’21, which were in the 20-30 percent range, happening. However, we are quickly approaching double-digit rejection rates which would signal a more balanced supply and demand freight market.
Shippers have been working with the luxury of not having to reach too far into their routing guides and carrier and broker partners. As the recent trends continue, freight acceptance compliance will become more challenging for them.
West Coast Ports Heat Up Again
The one thing that is somewhat unpredictable right now is import volumes and their impact on the freight market.
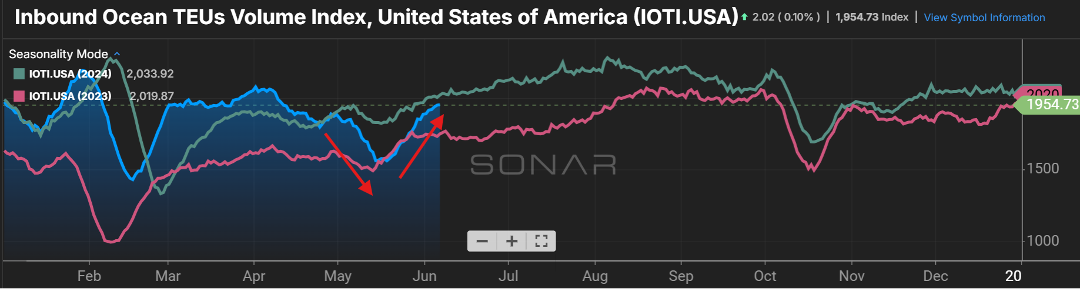
Figure 2.1 shows the slowdown of freight from overseas, most of which affected our West Coast ports. Once a handshake deal was in place to stave off steep tariffs with China, ships pulled up their anchors and chugged across the waters destined for the U.S.
Import volumes have recently surpassed 2023 levels and are soon to close in on 2024 volumes. Most of this freight will be more of a “just in case” scenario versus “just in time”. This will see a greater benefit to the rail industry versus truckload market, as freight that is not time sensitive has the luxury of taking longer to arrive at its destination at a lower cost.
Expect to see some volatility in truckload pricing in and around the LA/LB ports as capacity and freight volume imbalances collide.
Stay Up To dAte
Looking for a more frequent update? Subscribe to our newsletter and receive the top five logistics articles of the week every Friday morning by selecting “Weekly News Update” when you select your preferences.
Get Weekly News Updates in Your InboxStay up to date on the latest information on conditions impacting the freight market, curated by Trinity Logistics through our Freightwaves Sonar subscription.
Freight in Retreat
A picture is worth a thousand words.
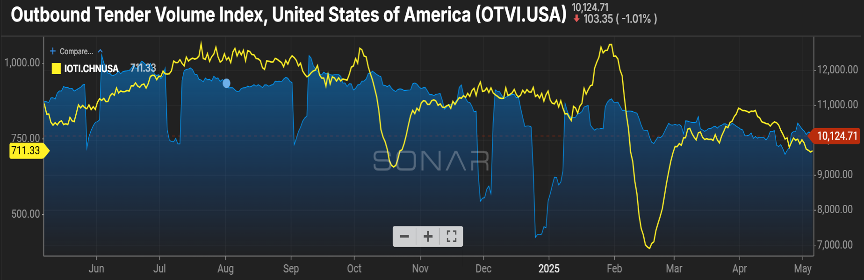
Figure 1.1 shows the initial impacts of the tariffs with regard to ocean containers and over-the-road trucking volumes. As you see by the yellow line, shippers were eager to get ahead of the pending tariffs with freight from China. But as the tit for tat trade war has continued, blank sailings and cancelled bookings are becoming common and has caused inbound container volume to trend downward, now sitting almost 20 percent less than this time last year.
This has translated into a regression in the over-the-road trucking volume, with the blue line starting to show a decline at time of year when freight volumes should be escalating with increased consumer activity and the start of produce season. Additionally, the lack of container volume has an impact on rail activity with total intermodal container volume receding five percent from where it was in March.
Carriers Struggle with Freight Shift
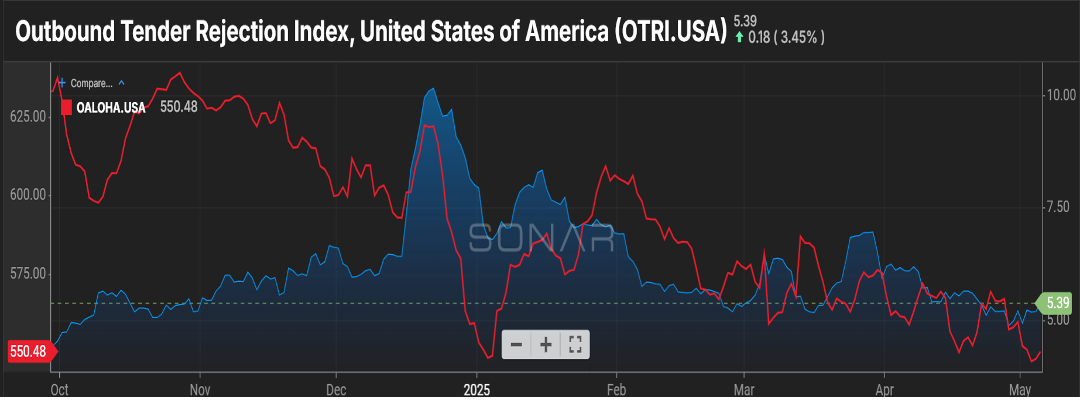
The rejection of freight tenders (OTRI.USA) has been relatively unchanged over the past month plus. This has been held up by a declining base of carriers. However, if you look at Figure 2.1 you will see via the red line that the average length of haul for shipments has been on a steady decline pretty much for the past year.
Yes, less import traffic plays into that, as those shipments typically head to larger metro areas (Chicago, Dallas) once they cross into our borders at the port. But a push for regionalization by shippers and an increase in e-commerce activity has also fueled more frequent but shorter distances for freight to travel, down about 12 percent from this time in 2024.
This is not great news for carriers as 75 miles less equates to a lower price they can command, but the mileage difference is not enough to allow them to compensate for the difference by additional freight moves during their work week.
Tariffs Price Out Small Carriers
The length and severity of the tariffs is not only having an immediate impact on trucking volumes, but it could be setting the industry up for a capacity shortage once calmer waters prevail. 25 percent tariffs on Mexican and Canadian imports have increased the cost of new trucks by almost $30,000, making it particularly challenging for smaller carriers to invest in new equipment, let alone new entrants to enter the carrier capacity market.
And for those looking to stretch the mileage out of older equipment, the increased cost for maintenance parts and fuel additives as a result of tariffs puts further strain on already tight budgets. Considering 93 percent of the for-hire carriers in the U.S. are less than 10 trucks, there could be a gaping hole to fill in the spot market when a freight rebound happens.
Stay Up To dAte
Looking for a more frequent update? Subscribe to our newsletter and receive the top five logistics articles of the week every Friday morning by selecting “Weekly News Update” when you select your preferences.
Get Weekly News Updates in Your InboxStay up to date on the latest information on conditions impacting the freight market, curated by Trinity Logistics through our Freightwaves Sonar subscription.
tarifFS AND TIGHT WALLETS
A colleague of mine told me recently that anytime you give a presentation around technology, there is an obligation, almost a duty, to include “AI”. Now, it feels like anytime you talk or write about things in the freight market, you have to include the word “tariffs”. The old saying, if you don’t laugh, you’ll cry seems very appropriate.
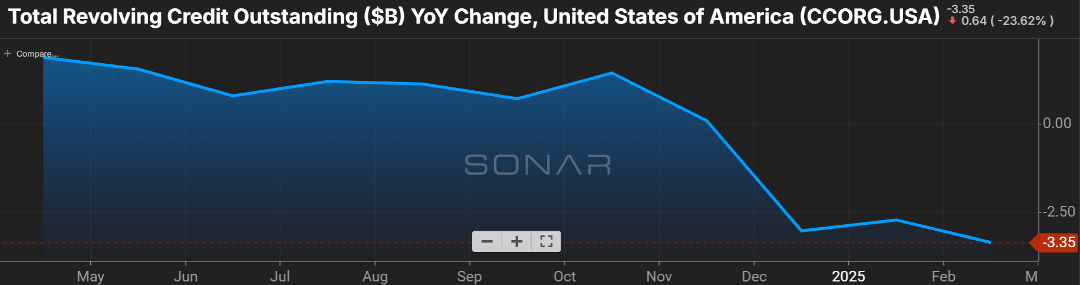
In 2024, 68 percent of personal consumer expenditures comprised our nation’s gross domestic product (GDP). This is concerning when you look at the trend over the last three months regarding consumer revolving credit.
As you can see below in Figure 1.1, year-over-year (YoY) there has been a decline. When customers feel skittish about taking on a new car loan or signing on the dotted line for a thirty-year mortgage, this has a trickle-down effect, not just on the immediate sectors, like the auto industry and housing, but those secondary and tertiary markets. If the pace of new homes being bought slows, then production of things that go into the home, like furniture, carpet, or fixtures, is also impacted negatively.
Some have pointed to the credit card revolving debt as a sign of the economy’s strength. That may have been a valid argument in January, when we saw a six percent YoY gain. But the recent report shows an annualized bump of only 0.1 percent, indicating that consumers are curtailing spending and relying on cash at hand to fund purchases versus credit cards.
Don’t be surprised if long-term debt, like auto loans, starts to show an uptick in delinquency.
Tiny Shifts, but Big Waves
As the threat of the “T” word continues, the freight market continues to see the pull forward of goods entering the U.S. as shippers look to get ahead of an increase in production costs.
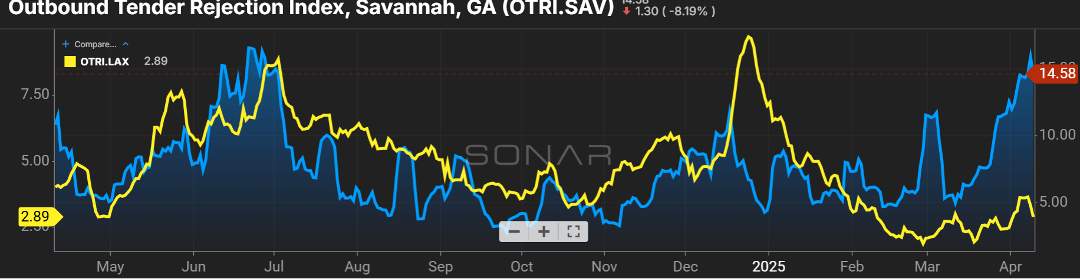
While a slight increase in port areas like Los Angeles may seem like no big deal (Figure 2.1), keep in mind over half of the import volume funnels through the LA/LB ports. Even going from a 2.5 percent rejection rate to now in the five percent range (yellow line) may not seem significant. However, when you apply that change to 413k shipments in February alone, it becomes a significant impact.
A port like Savannah (blue line) shows the impact of a fragile capacity balance, and even a slight uptick can be needle moving for rejection of freight tenders. While not to the size of the LA/LB ports, handling 265k import containers in March, a surge in volume of 30k containers compared to February 2025, an imbalance in capacity can quickly escalate rejection rates close to 15 percent as they stand currently.
Stay Up To dAte
Looking for a more frequent update? Subscribe to our newsletter and receive the top five logistics articles of the week every Friday morning by selecting “Weekly News Update” when you select your preferences.
Get Weekly News Updates in Your InboxStay up to date on the latest information on conditions impacting the freight market, curated by Trinity Logistics through our Freightwaves Sonar subscription.
Spring Thaw or Economic Chill? Key Indicators to Watch in 2025
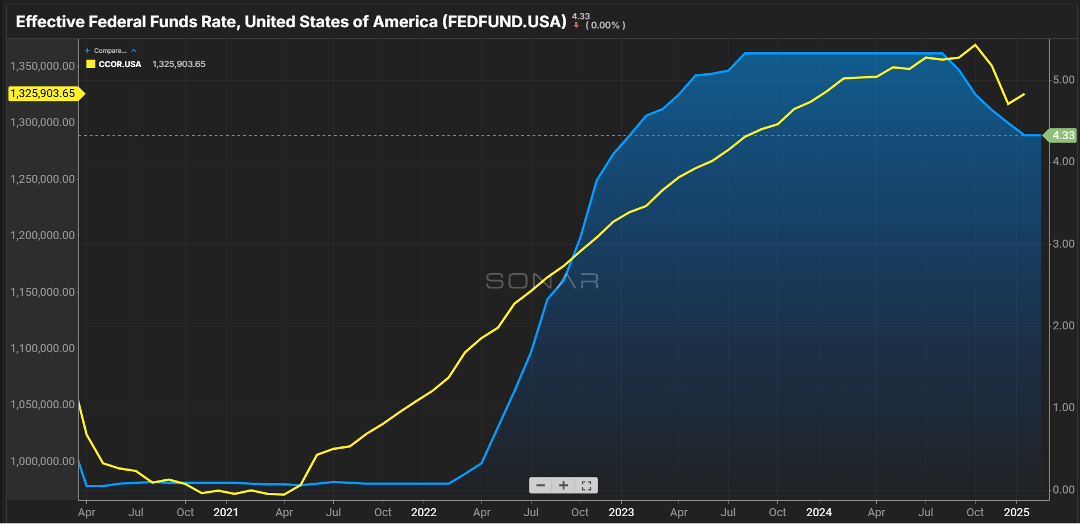
Normally we look at over-the-road or port volumes, what carrier rejections look like, and how that is impacting freight rates. This month, we’re going to shift a bit and look at things from more of an economic standpoint. The first chart, Figure 1.1, shows the federal funds rate and consumer debt. Consumer spending accounts for a large portion of GDP with dollars they spend on things as well as services.
The latter part of 2024 saw multiple cuts to interest rates. However, the expectation heading into 2025 was that any relief on rates would not be seen until the second half of the year as typically those who make the decisions take a bit of a ‘wait-and-see’ approach as there were several new players on the committee in their first meeting.
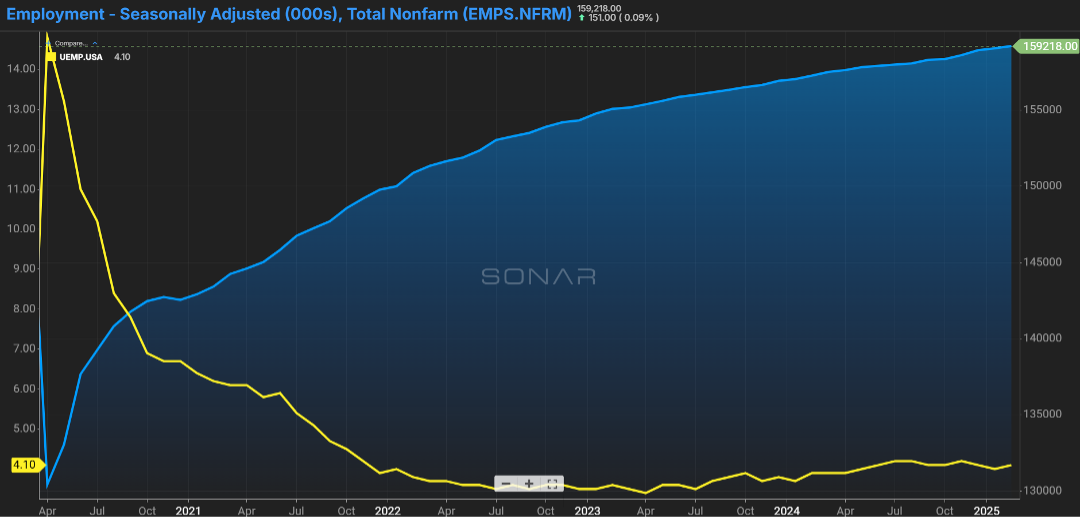
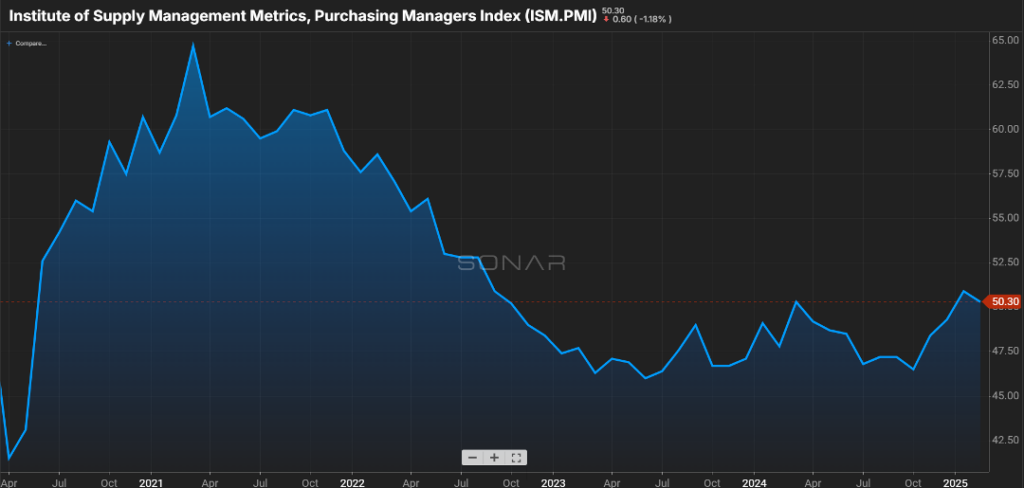
One area that members of the committee look toward is the strength of the labor market. While the jobs report showed numbers for the first two months of the year slightly below the forecast, the unemployment rate continued to hover in the 4% range (Figure 2.1). Another encouraging sign is the slight increase in jobs across the manufacturing and construction sectors. Coupled with the ISM breaching the 50 mark, which is typically the point of determining positive versus negative sentiment in these industries, there is optimism as the Spring thaw begins (Figure 2.2).
I would be remiss if I did not mention recently enacted and pending tariffs. I think anyone that gives an update on the economy is now required to mention the “T” word. Things like steel, aluminum, and lumber that have been at the center of these talks are commodities that support manufacturing, and a decline in volume or an increase in the cost of these goods could hamper the manufacturing sector.
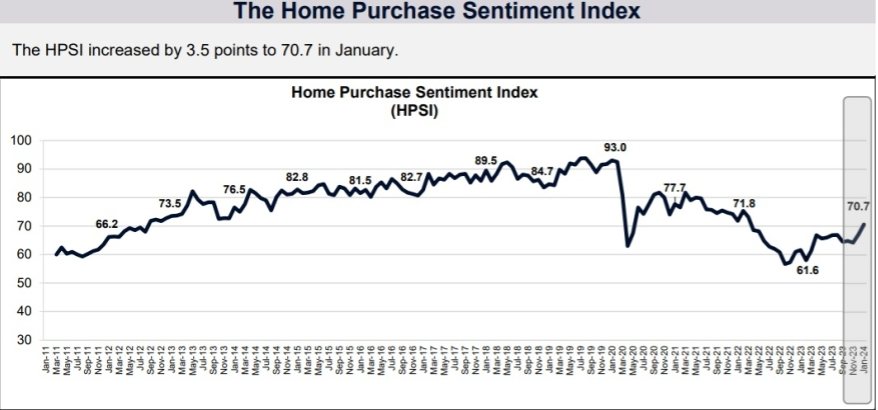
Another area in the news relates to home purchasing. Fannie Mae publishes the Home Purchase Sentiment Index, (Figure 3.1) which has shown a slight uptick in the last several months. Consumers who felt now was a good time to sell a home rose to 65 percent, up from 60 percent in January.
While the same cannot be said for those in the market to buy; only 19 percent of consumers felt it was a good time to buy., a modest increase from the end of 2024. Much of that optimism is based on anticipated relief with mortgage rates, something consumers believe the second half of the year will offer. Will we see rates of three percent that existed back in ’21 & ’22? Most likely, no, but rates in the five or six percent range can be a swing of several hundreds of dollars on a family’s monthly mortgage payment.
Stay Up To dAte
Looking for a more frequent update? Subscribe to our newsletter and receive the top five logistics articles of the week every Friday morning by selecting “Weekly News Update” when you select your preferences.
Get Weekly News Updates in Your InboxMost of us over the age of 25 can remember when the World Wide Web made its debut. We remember the “beep-boop” sound of dial-up and the big chunky computers that were as wide as a television set in the 1990’s. It’s been almost 30 years since the dawn of the Internet. It’s mystifying to look at the impact it still has on our everyday lives. Because of the Internet, e-commerce was born, and the need for flatbed shipping has increased.
The Beginning of ECommerce
Over time, ecommerce has taken the baton from traditional brick-and-mortar stores, leaving many big-box store retailers high and dry. Since Amazon Prime’s arrival in 2005, online shopping has exploded in the marketplace. The ease and convenience of it have forced many retailers to develop a strong online presence or risk closing their doors for good.
COVID-19 Creates Rapid Growth
Due to health concerns and social distancing practices, COVID-19 rapidly escalated the use of ecommerce. Total online spending in May 2020 was up 77 percent year-over-year (YOY), according to a report on online spending released in June by Adobe. In that report, Vivek Pandya, Adobe’s Digital Insights Manager, states that it would have typically taken 4-6 years to see the level of growth in online shopping that was seen then. Contactless online ordering helped individuals attempt to limit their exposure to the virus by shopping from home, so it’s easy to see why those reported numbers were so high.
Since the pandemic, the changes in the ways consumers shop have remained. While in-person shopping has increased compared to then, it still lacks in the amount of foot traffic that was received previously. Consumers continue to like the ease of online shopping, and with fewer in-person shoppers, companies are investing less in their brick-and-mortar locations, which has only made people less likely to want to shop in person. In fact, it’s estimated that 40,000 to 50,000 retail stores will close in the next five years, according to the UBS investment bank.
Ecommerce continues to experience growth, with 22 percent of retail sales being online in 2023, the largest U.S. ecommerce sales percentage to date, according to the U.S. Department of Commerce. As e-commerce growth carries on, it’s created a growing need for companies to expand their inventory and improve their ability to distribute their products. What used to be a problem of “too much” storage space for companies before the pandemic has quickly turned into a necessity in today’s time.
The Need for Storage Space
As online distributors continue to see growth, their need for storage space has grown as well. Prior to Covid-19, one or two warehouses could keep a medium-sized company running efficiently. Now, more space is needed to keep up with the increasing demand of companies. Having more than one distribution center can be a huge benefit to a company’s ability to stay successful these days.
This all trickles down to the construction industry. As demand grows for new or renovated warehousing, the need for building materials to meet that demand has also increased.
How ECommerce Growth Affects Flatbed Shipping
Flatbed shipping has always been a leading mode of transportation for industrial freight. Lumber, stone, racking, and other building materials travel best on an open trailer due to their odd dimensions and additional weight requirements.
Looking for an extensive guide to keep on hand for your over-dimensional shipping?
Download our FREE guide!Usually, flatbed shipping sees an increase in volume in the summer months. Construction companies take advantage of the warmer weather, which is most suitable for outdoor construction work. During this peak shipping flatbed season, it’s not unusual to see tightened capacity and higher freight rates, but any added demand for warehousing can add to that, making securing a flatbed carrier more difficult.
Strong Relationships Help
Having a relationship with a third-party logistics company (3PL can be a benefit to those who coordinate freight to be delivered to a job site. Typically, job site freight is very hands-on and has a perpetual knack for being time-sensitive. Installation crews are on-site to receive and install the material scheduled to be delivered. Even the slightest delay can cause significant ramifications to the completion of the construction project. Having a strong relationship with a 3PL can help companies mitigate risk, reduce costs, and provide peace of mind to those who are coordinating the freight.
Be Ready for Anything
It appears online shopping is here for the long-haul and whether it’s causing you to expand your warehousing or not a 3PL like Trinity Logistics can help you be prepared for any changes that may come your way. With Trinity, you’ll gain a Team of experts that can help you optimize your supply chain and arrange shipping for various of transportation modes, including flatbed, while offering end-to-end visibility of your shipments. No matter what changes the future brings, you can stay one step ahead when you choose to have Trinity Logistics by your side.
HVAC contractors and plumbers continue to face supply chain woes like material shortages and rising costs.
Battling these issues is making it tougher for HVAC contractors and plumbers to meet their customer’s demands in the short term and perhaps even longer. Here’s what HVAC contractors and plumbers can do to rise above.
WORK WITH MANY SUPPLIERS
If current suppliers can’t meet your needs, then it’s a good time to explore other ones. Many suppliers are ready to strike up new relationships and may be willing to be more flexible with contracts. Shopping with multiple suppliers will not only gain you access to more resources but can offer you more varied pricing options to consider.
CONSIDER ALTERNATIVE MATERIALS
It might be worth checking into other materials as they may be easier to get your hands on. Considering other brands of materials or equipment can keep your projects from staying stagnant.
COMMUNICATION IS KING
In difficult times like these, communication can be something that gives your company a competitive edge. Not only is it a vital aspect of a successful business, but it helps build trust and long-lasting relationships. While no one likes delivering bad news about backorders or delays, keeping your customers informed will go far, as they’ll appreciate your honesty and transparency.
IMPROVING CUSTOMER SERVICE
While material shortages and delays are out of your hands, great customer service will keep your current customers and help you gain new ones. In addition, extra attention to customer service can help address any frustrations among your customers. While these challenges may not last forever, your reputation will, so make sure yours remains good, if not great.
PRE-ORDER MATERIALS AND EQUIPMENT
Many HVAC contractors and plumbers often only order the materials and equipment as needed. Instead, plan and stock up on the materials you most often use for your projects. This way, you’ll have what you need ready instead of waiting for materials to deliver.
CONSIDER MODE DIVERSIFICATION
Trying different modes of transportation could help you offset your increased costs. Keep an eye on transportation costs across the different modes available. Being more flexible with your freight shipping can give you some financial benefits.
INVEST IN TECHNOLOGY
Logistics technology, like a transportation management system (TMS), has tools available to help you stay on top of your supply chain and plan efficiently. One example is helping you with your routing decisions by matching your freight with the best carriers, lanes, rates, and transit service. It will also enable you to better track and manage any service disruptions or shipment delays in real-time, thus increasing your service levels and improving your customer relationships.
THINK ABOUT ONSHORING
Onshoring is a strategy that HVAC contractors and plumbers can use to mitigate supply chain woes and improve competitiveness. Onshoring strategy can ensure resilience in your supply chain and give your company a competitive edge.
Onshoring refers to the overall practice of moving manufacturing operations from foreign soil back to the United States or outsourcing to domestic contract manufacturers rather than overseas. An example of onshoring would be having operations moved to Mexico versus China.
Onshoring allows your supply chain shorter travel times since materials and products are much closer than if they were overseas. This not only keeps your projects moving that much quicker but reduces your transportation costs. Additionally, you’ll also have the benefit of being greener due to less fuel being used.
CONSIDER OUTSOURCING YOUR LOGISTICS
According to the 2020 Annual Third-Party Logistics Study, 67 percent of shippers stating using a 3PL contributed to reducing their logistics cost, while 83 percent said it improved their service. By outsourcing to a 3PL, like Trinity Logistics, you won’t have to spend hours worrying about your logistics and get the help you may need to be more flexible with your shipping options.
“In this market where it’s difficult to meet demand and project deadlines due to material and product shortages, it may not be the best option to send it via LTL as you may save a few dollars on the front end but pay for it with extended estimated transit times, and the possibility of the parts being damaged as they go from terminal to terminal throughout transit. Working with a 3PL, like Trinity Logistics, can bring you other possibilities on how to move your freight efficiently, such as dedicated full truck options, expedited (straight trucks/sprinter vans), partial, and hot shot options to keep your freight moving to arrive on time so you can achieve your project deadlines.”
– Michael Whitaker, Business Development Representative at Trinity Logistics
If you’re looking for a reliable 3PL provider to help with your HVAC supply chain, consider Trinity Logistics. With Trinity, you gain a Team of experts to help optimize your supply chain, help arrange shipping using other modes, and end-to-end visibility through our available technology.
DISCOVER TRINITY LOGISTICSOversized shipping can take a lot of work. Since oversized shipments require extra handling and planning, it’s easy to run into some challenges with them. In this blog, we’ll cover the top five challenges that come with oversized shipping and solutions, so you’ll know how to overcome them.
- Oversized Shipping Challenge 1: Late or Lost Freight
- Oversized Shipping Challenge 2: Meeting Regulations
- Oversized Shipping Challenge 3: Finding the Right Carrier and Equipment
- Oversized Shipping Challenge 4: Safety
- Oversized Shipping Challenge 5: Lack of Communication Among Partners
Oversized Shipping Challenge 1: Late or Lost Freight
The construction and manufacturing industry is one that relies on oversized shipping. This industry has tight schedules to meet to keep their projects moving. This is why professionals, such as construction project managers are responsible for coordinating shipments of equipment or material to and from job sites. When planning, transit and arrival times must be clear and transparent to coordinate labor and proper personnel to be onsite when deliveries arrive.
Because freight must arrive at the right time and place, it’s important not to fall behind or incur additional labor costs. Project managers also often juggle multiple projects, and without the right processes in place, this can become overwhelming. Too often, project managers receive too late notice on delayed freight causing them to have to push back their project schedule. Additionally, at times shipments somehow don’t reach their delivery location or may arrive at the wrong one.
Your Solution: Use Logistics Technology for Visibility
Adopting logistics technology will allow you to easily track all your shipments, no matter how many projects you must manage. There are many logistics technologies options you can choose from for visibility. For example, a Transportation Management System allows you to not only receive tracking notifications, but automatically share them with you external partners. Additionally, you can use outside tracking vendors such as Fourkites or TruckerTools.
While searching for the right technology for your company’s needs can be daunting, consider working with a third-party logistics provider (3PL), like Trinity. It can be less costly to access the technology you need through them, and you’ll have experts on your side to help you.
Oversized Shipping Challenge 2: Meeting Regulations
Drivers hauling any load that exceeds legal limits in weight or size MUS get a permit for the state they are traveling through. If an oversized shipment travels through multiple states, that may mean multiple permits, or else it can result in fines.
Oversized shipments may also require pilot cars and/or police escorts depending on the characteristics of the load and states they travel through. Both permit and escort regulations vary by state, and depending on what is needed, the processing time could take several hours or days to obtain. As a result, planning shipments and making sure guidelines are adhered to can be both frustrating and time-consuming.
Solution: Simplify your workload by outsourcing
Take the weight off your shoulders and let someone else handle the logistics. Outsourcing opens up your schedule so you can focus on what you do best. But, don’t just outsource to anyone. Instead, make sure to choose a logistics provider who understands your freight’s regulations and has experience in doing so.
Oversized Shipping Challenge 3: Finding the Right Carrier and Equipment
Besides meeting legal regulations, oversized freight needs the right equipment and carrier to move it, at the right price for your budget. Sometimes that can be tough to find on your own, especially when capacity is tight.
Solution: Make Use of a 3PL’s Network
What’s another reason to consider outsourcing? Using a 3PL means you’ll have the advantage of their vast carrier network. A 3PL’s sole service is logistics, so they need relationships with carriers to move freight. A quality 3PL will often have an extensive carrier network with a nationwide presence.
Oversized Shipping Challenge 4: Safety
Safety equipment for oversized shipments includes warning signs, flags, and lights to give visibility to other drivers of the oversized load and its edges. Rules and regulations vary again by state. Additionally, there is proper tarping, strapping, and securement of your freight on the truck that is needed. Loose cargo that falls off can cause traffic problems and has the potential to be deadly or hurt someone. Making sure the right materials are used to tie down the freight and make it visible to everyone is important.
Solution: Make Sure Who You Work with Has Experience
You don’t want just anyone moving freight: you want the best. Unfortunately, it can take a lot of your tome to find the best carrier to safely move your shipments. 3PL’s have experience working with carriers and have built relationships over time with ones who provide the best service. We properly vet our carriers during the shipment selection so that we can guarantee your freight will arrive at its destination safely.
Oversized Shipping Challenge 5: Lack of Communication Among Partners
Too often, there will be lack of communication between shipper, receiver, and carriers. It could be a lack of communication about a needed permit and who has to get it, or about the proper equipment that is needed to unload at the receiver. This can lead to frustrated parties and delays in a project.
Solution: Gain Help with Managing your Logistics
A 3PL can be described as the middleman between customer and carrier. We help manage your logistics so jobs run smoothly, and you can focus on other aspects of your business.
At Trinity, we pride ourselves on proper and extensive communication before, during, and after a shipment. If making use of a TMS, you can choose how extensive you want to integrate the technology with your supply chain, allowing both you and your external partners more visibility and coordination with your shipments. This allows everyone the ability to stay connected and up to date.
It seems like many of oversized shipping challenges can be solved by selecting to work with a 3PL. of course, you can choose to try to solve them all on your own manually, but why not save the time and consult an expert, like Trinity, for help? We offer you a range of services and technology to make your workload easier. We’ve been in the business forever 40 years and take pride in what we do – solving complex logistics problems for companies like you.
By: Christine Morris
Does the COVID-19 vaccine have your cold chain logistics worried? If not, you should be taking it into consideration.
Everyone’s over the pandemic. We’re ready to be back attending public events, traveling to popular destinations, have our kids in school full time, and more. So much of 2020 has had to cancel or make the move to virtual and it’s not the same. Additionally, here at Trinity, the health and wellbeing of our Team Members, Authorized Agents, Carriers, and Customers is our number one priority.
Pfizer, Moderna, and others have quickly turned around vaccine solutions, making the light at the end of the tunnel seem in reach. With everyone looking to gain some sense of normal back into their lives, it means all hands will be on deck for the upcoming vaccine distribution. That means other cold chain commodities, will fall lower in priority. How will this affect your cold chain logistics?
THE IMPORTANT ROLE OF COLD CHAIN LOGISTICS FOR A COVID-19 VACCINE
Vaccines are fragile. Most have to store at specific colder temperatures to protect them from deterioration. If left out too long or exposed to fluctuating temperatures, vaccines can lose their effectiveness. According to the World Health Organization, one in four vaccines loses its integrity during transit. Due to their fragility and the extensive attention to detail that the logistics sector has to maintain, roughly 80 percent of a vaccine’s cost comes from its storage and transport.
Usually vaccines transport in temperature ranges of two to eight degrees Celsius. Currently, nine COVID-19 vaccines are in their Phase 3 trials, with two, Pfizer and Moderna, being very close to distribution. Because of the quick turnaround the world is seeking, these vaccines are containing higher protein bases which need ultracold temperatures, as low as minus 80 degree Celsius. Those receiving vaccines will need to get two doses, each about three to four weeks apart. Over time, vaccines will be developedrequiring more typical refrigeration temperatures and single doses. Regardless, cold chain logistics will continue to play a vital role in the distribution of a COVID-19 vaccine and for now, the specifications will be strict.
ALL COLD CHAIN HANDS ON DECK
Currently, Pfizer expects to produce and distribute up to 50 million doses of their vaccine in 2020 and 1.3 billion in 2021; Moderna expects 20 million in 2020 and anywhere from 500 million to one billion in 2021. Not to mention the other vaccines that will make their way as well. It is estimated that to immunize 7.8 billion people worldwide, 10 billion doses of a coronavirus vaccine will be needed.
The FMCSA recently announced their most recent extension of the Hours-of-Service waiver to February 28th and included carriers transporting COVID-19 vaccines. This effort is expected to be the biggest challenge the logistics sector has ever faced. Currently, logistics experts are struggling to plan ahead because of the lack of very specific information that they need to know about, such as the packaging, amount of dry ice needed to maintain temperatures, warehousing, equipment needed, and more.
Shipping temperature-sensitive items? Check out our Temperature Shipping Guide.
AREAS TO WATCH
Through Operation Warp Speed, Moderna and other upcoming vaccines will deliver to the Mckesson distribution center in Irving, Texas, and then arranged deliveries to hospitals, nursing homes, and other determined points. Moderna will manufacture its vaccine in New Hampshire, Pennsylvania, and Indiana.
Pfizer, however, has chosen to not distribute through Operation Warp Speed. They manufacture their vaccine in Michigan and plan to ship with transportation providers such as UPS and FedEx to locations around the country. They’ve chosen to directly ship to gain greater control and real-time insights into the status of their frozen vials.
HOW IT AFFECTS CAPACITY
Obviously, reefer capacity is going to be needed for vaccine distribution. But, it’s already tight. If you’re in the cold chain, shipping temperature-controlled items, prepare to continue paying premiums for this service.
Recently, reefer rejection rates have been at almost 50 percent. That means almost one out of every two reefer shipments are being turned down by carriers. When the rejection rates are higher, the tighter capacity is, and the higher cost for you to get your cold freight moved. Reefer rates are already 20 percent higher year-over-year due to increased consumer demand while spending more time at home.
WHAT THIS MEANS FOR YOU
If you ship temperature-controlled goods, the upcoming vaccine distribution efforts should be a concern for your business and logistics, especially if you regularly ship through less-than-truckload (LTL). Many top tier transportation companies such as UPS, FedEx, and DHL are ready to help Operation Warp Speed in the vaccine distribution. Everyone knows the vaccine distribution is the highest priority, but transportation providers also know they will be well compensated for their service of transporting it. This means other cold chain commodities will be pushed further down in priority. This will only continue on as more COVID vaccines become available to be distributed and until risk of COVID is greatly reduced. In the form of some ultracold transportation logistics, winter is coming and the demand for reefers will continue to rise.
SHIPPING COLD CHAIN? WHAT YOU CAN DO TO PREPARE
Communicate.
Get ready now. Start talking to your relationships and providers to make sure you will have trucks to move your freight. Talk to your customers. Let them know now that things may slow down or get behind with the upcoming and expected vaccine distribution efforts.
Things may be getting tougher for you, but I think we all know this is good. We’re one step closer to returning to some sense of normalcy. Hold on, because the light at the end of the tunnel is there. It’s now in reach. We’re just in for a few more bumps in the road, but we’ll make it.
Looking for an expert in cold chain logistics?
Find Your Solutions with TrinityAuthor: Christine Morris