
05/18/2026 by Greg Massey
May 2026 Freight Market Update
Get the latest insights shaping the logistics industry with Trinity’s May 2026 Freight Market Update, powered by our Freightwaves Sonar subscription.
A Market in Transition
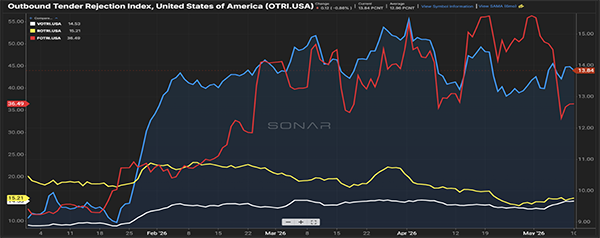
Much of the recent conversations have been around the rate at which carriers are rejecting shipments where a contracted rate is in place with the shipper.
Figure 1.1 shows that elevation over the last 90 days, being led by the flatbed sector with a rejection rate of just over 1 out of every 3 shipments. What has not been getting as much press is the overall volume of freight in the industry as seen in Figure 1.2.
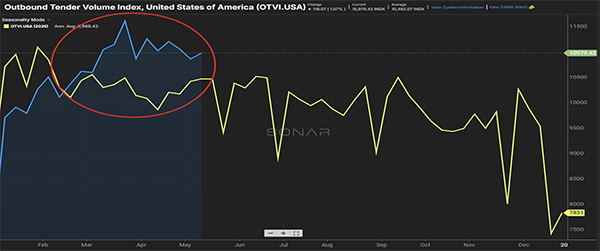
Sure, it’s anticipated that April and May see the effects of produce as we head towards the early summer peak freight months. But we’re seeing volumes that are trending 5-10% higher than last year for the last few months.
Well wait a minute, if the volumes are trending up, then why are the overall tender rejection rates trending slightly down? The simple answer is that shippers have right-sized pricing guides to reflect the market.
For all of ’24 and ’25, there was not much movement in the freight rates. That changed almost overnight at the start of this year, and it has taken a few months for shippers to adjust.
While a slight softening in rejection rates suggests a better rate and volume balance, an average rejection rate of almost 14% shows a slight advantage to carriers when it comes to rate negotiations.
The Compliance Impact Grows
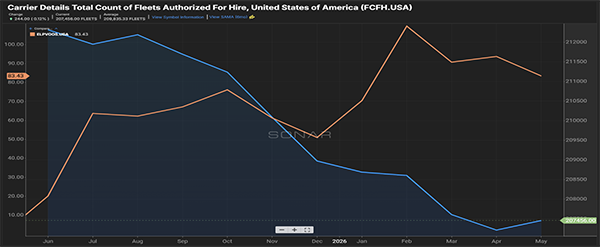
The chatter is not as heavy around the impact of drivers being taken out of the market due to non-compliance with the English language proficiency mandate, but it is still happening and impacting overall capacity.
Figure 2.1 shows a decline over the last year with the count of for-hire carriers, with a reduction of about 3% over the past year. Conversely, the number of drivers being sidelined because of failing to understand basic commands and road signs in English has increased over that same time. On average, 83 drivers are being placed out of commission daily.
While nobody likes to see people being placed in a position of not being able to work, from a safety perspective, for those being entrusted with the safe operation of an 80,000-pound vehicle on U.S. roads, being able to understand warnings and potential hazards is paramount.
Imports Picking Back Up
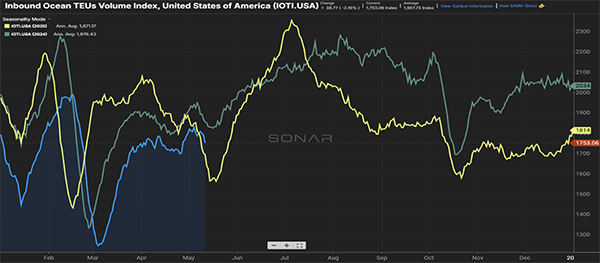
With all the talk about domestic over-the-road volumes, it can be easy to forget what is happening at our U.S. ports.
There are several overhanging themes, with the global trade war and the happenings in the Strait of Hormuz. Figure 3.1 shows the impact on inbound container volumes, a slight decline versus prior years year-to-date, but recent volumes have slightly surged ahead of the 2025 pace.
It’s anticipated that volumes will start to increase as we head towards peak season, with more than normal volume of this import freight traveling to its final destination via rail versus over-the-road.
Don’t Let Market Shifts catch you off guard
Freight conditions can shift quickly and have a major impact on your transportation strategy. Subscribe to receive our monthly Freight Market Update in your inbox and also have the option to receive our Weekly News update for a quick Friday morning snapshot of what’s shaping the market.
Don't Miss the Next One – Sign UpLooking for a more reliable transportation strategy? Request a free quote for your next shipment and see how Trinity helps shippers stay flexible in changing market conditions.
Quote Your Next Shipment With Trinity